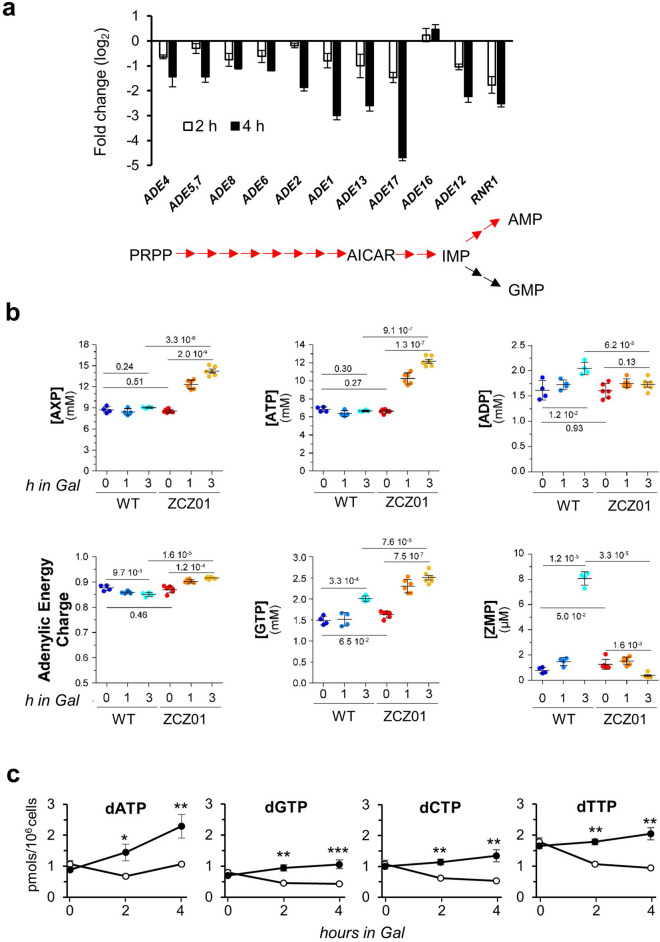
Figure 3.
Overexpression of Ppz1 increases energetically charged purine nucleotide levels. (a) Expression levels of genes that define the de novo purine biosynthetic pathway derived from the RNA-seq data (ordered according to their sequence in the pathway, schematically shown at the bottom of the histogram). RNR1, encoding the large subunit of ribonucleotide reductase, is also included. (b) The intracellular concentrations of the indicated purine-containing molecules were determined in exponentially growing cells in YP-Raff (2%) with addition of galactose 2% (Gal) at time 0. Metabolic extracts were normalized to cell number and median cell volume and results (from 4 to 6 independent extractions) are given as internal concentrations ± SD of adenylic nucleotides inferred from standard curves using pure compounds. Statistical analysis was performed with Welch’s unpaired t-test (p-values are indicated in the graphs). The concentration of AXP is the sum of the concentrations of ATP, ADP, and AMP. ZMP (AICAR monosphosphate) is the 5-aminoimidazole-4-carboxamide ribonucleotide intermediate. (c) Determination of dNTPs levels in wild type (open circle, BY4741), and Ppz1-overexpressing (filled circle, ZCZ01) cells. Cells grown on YP-Raff were collected at time 0 and 2 and 4 h after addition of 2% galactose and processed as described in Material and Methods. Data correspond to the mean ± SEM from 3 to 5 independent experiments. *p < 0.05; **p < 0.01; ***p < 0.001, calculated by the Student’s t-test.

