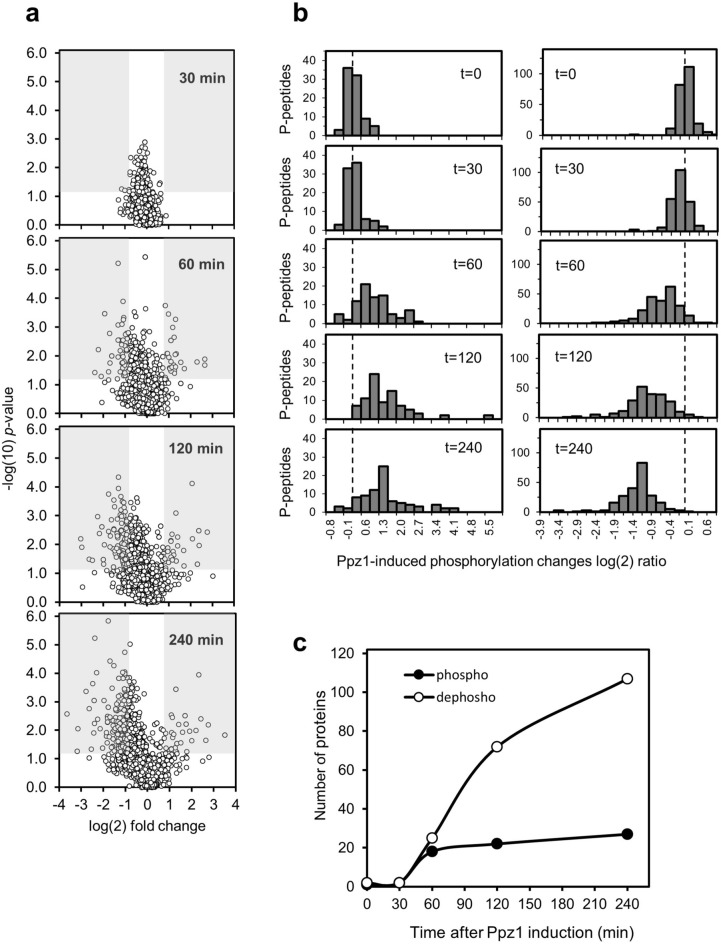
Figure 4.
Changes with time in phosphorylation profile upon overexpression of Ppz1. (a) The significance versus fold-change in phosphorylation (y and x axes, respectively) of the 6,008 unique phosphosites identified in this work and their variation along time with overexpression of Ppz1 is represented as a Volcano plot. Fold-change is calculated as the ratio of Ppz1-overexpressing cells vs control cells, for each time and compared with t = 0. Shadows denote regions in which log(2) value of the change is ≥ 1 (phosphorylated) or ≤ − 1 (dephosphorylated), and p-value ≤ 0.05. (b) Data for a total number of 230 dephosphorylated (right panel) and 85 phosphorylated phosphopeptides (left panel) showing statistically significant changes at least at one time-point was log(2) transformed and plotted. The discontinuous line marks the zero point in the X-axis. (c) Variation of the number of phospho- (filled circle) and dephosphorylated (open circle) proteins along the experiment.

