Figure 5.
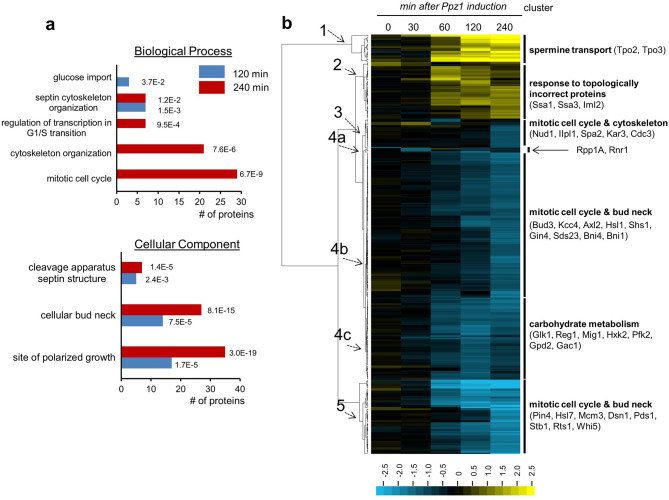
Clustering analysis of phosphoproteome changes upon Ppz1 overexpression. (a) The set of proteins dephosphorylated at t = 120 and t = 240 (72 and 107, respectively) were subjected to Gene Ontology analysis using the YeastMine tool at SGD with default settings. (b) Data from 385 phosphosites (phospho- or dephosphorylated) was calculated as the ratio between Ppz1-overexpressing cells and control cells. Log(2) transformed data was clustered with the Gene Cluster software (Euclidean distance/complete linkage) and the result was visualized with Java Tree View (v. 1.145). The intensity of the phosphorylation change can be deduced by comparison with the enclosed scale (log(2) values). Data is presented for all time-points even if in some cases the p-value between experiments is > 0.05.

