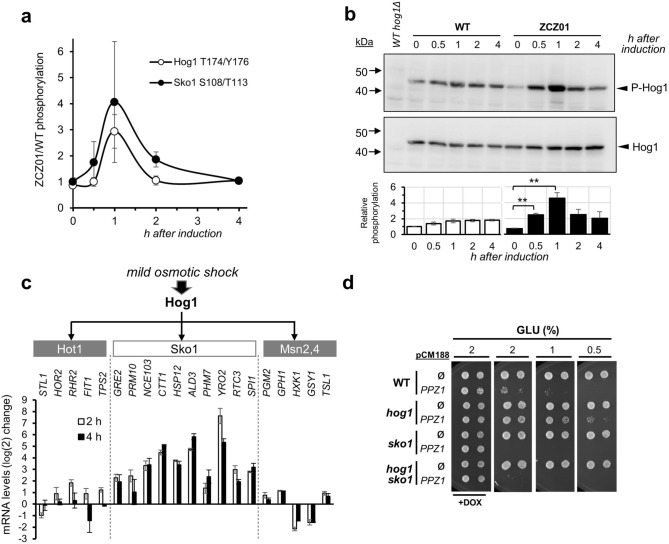
Figure 8.
Hog1 and Sko1 mediate part of the signals elicited by overexpression of Ppz1. (a) Changes in phosphorylation of Hog1 (Thr174/Tyr176) and Sko1 (Ser108/Thr113) derived from the phosphoproteomic experiments. Data represent the mean ± SEM from two (Hog1) and four (Sko1) datasets. (b) Upper panel. BY4741 (WT) and ZCZ01 cultures in YP-Raff received 2% galactose to promote Ppz1 induction. Protein extracts (40 µg of proteins) were subjected to SDS-PAGE (10% polyacrylamide), transferred to membranes and immunoblotted with anti P-Hog1 (P-Thr174/Tyr176) antibodies. Upon detection, membranes were stripped and probed with anti Hog1 antibodies to detect the amount of total Hog1. Lower panel. Signals corresponding to P-Hog1 and Hog1 were integrated and the P-Hog1/Hog1 ratio calculated for each time point. The values from three independent experiments were combined and the result for the WT strain at time = 0 was taken as the unit. Data is expressed as mean ± SEM (n = 3). **p < 0.01 calculated by the Student’s t-test. (c) Twenty representative genes proposed to be induced by Hog1 activation (exposure to 0.375 M KCl) mainly due to involvement of the Hot1, Sko1 and Mns2/4 downstream components were selected based on data from Supplementary Table S242 and the corresponding GEO entry (accession number GSE1227). The change in expression for these genes after 2 and 4 h upon induction of Ppz1 is plotted as the mean ± SEM (n = 3). (d) The indicated strains in the BY4741 background (WT) were transformed with plasmid pCM188-PPZ1. Overnight cultures were grown in SC medium lacking uracil with 100 µg/ml of doxycycline, washed twice with the same medium lacking doxycycline, resuspended in this medium and grown for five hours before spotting in plates with (+ DOX) or without doxycycline and containing the indicated amounts of glucose as carbon source. Pictures were taken after 3 days.

