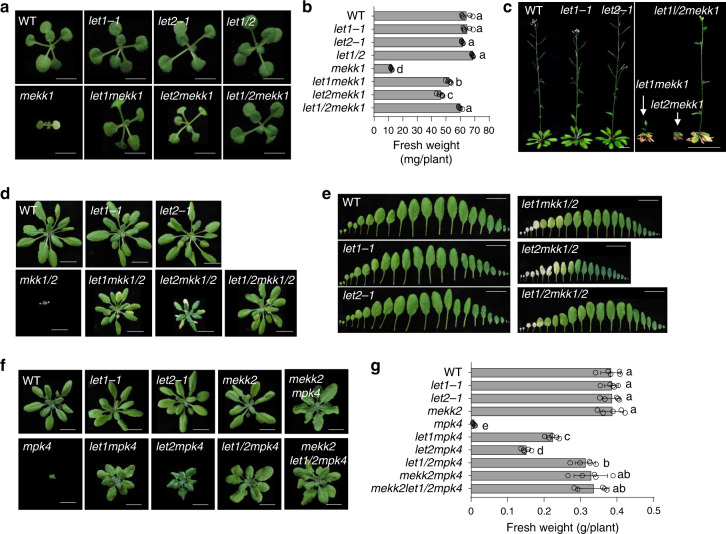
Fig. 2. LET1 and LET2/MDS1 function additively in regulating mekk1, mkk1/2, and mpk4 cell death.
a–c LET1 and LET2/MDS1 function additively in regulating mekk1 cell death. a Two-week-old plants of different genotypes grown on ½MS plates are shown. Scale bar, 0.5 cm. b The fresh weight of the indicated plants in a. The data are shown as the mean ± SE (n = 5). P = 1.00 × 10⁻¹³ (column 5 and 6), P = 1.00 × 10⁻¹³ (column 5 and 7), P = 1.00 × 10⁻¹³ (column 5 and 8), P = 1.53 × 10⁻⁵ (column 6 and 8), and P = 5.71 × 10⁻¹¹ (column 7 and 8). The different letters indicate the significant difference determined by one-way ANOVA followed by the Tukey test (P < 0.05). c Six-week-old soil-grown plants are shown. Scale bar, 1 cm (left panel) and 2 cm (right panel). d, e LET1 and LET2/MDS1 function additively in regulating mkk1/2 cell death. Four-week-old soil-grown plants (d) and leaves (e) are shown. Scale bar, 1 cm. The leaves from the individual plants were placed with the order of age (from oldest to youngest). f, g LET1 and LET2/MDS1 function additively in regulating mpk4 cell death. Four-week-old soil-grown plants (f) and their fresh weight (g) are shown. Scale bar, 1 cm. The data are shown as the mean ± SE (n = 5) with one-way ANOVA followed by the Tukey test (P < 0.05). P = 7.72 × 10⁻¹³ (column 5 and 6), P = 3.51 × 10⁻⁸ (column 5 and 7), P = 4.71 × 10⁻¹³ (column 5 and 8), P = 4.71 × 10⁻¹³ (column 5 and 9), and P = 4.71 × 10⁻¹³ (column 5 and 10). The above experiments were repeated three times with similar results.

