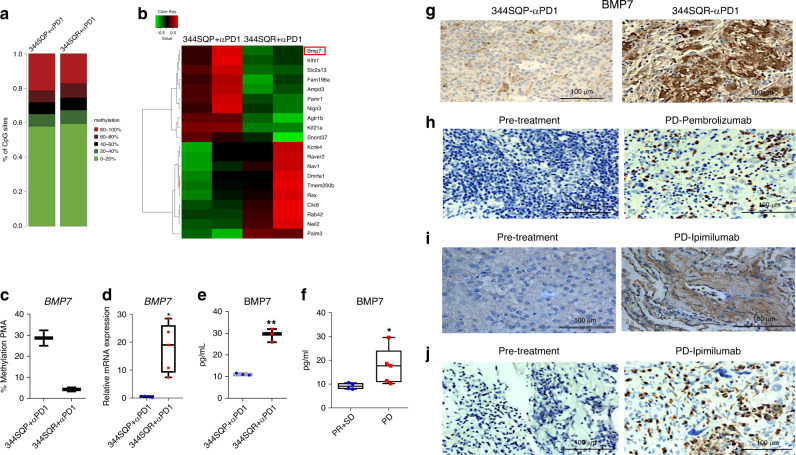
Fig. 1. BMP7 is upregulated in tumors resistant to immunotherapies.
a, b Reduced representation bisulfite sequencing (RRBS) results from 344SQP (parental) (n = 2 biologically independent samples) and 344SQR (anti-PD1-resistant) (n = 2 biologically independent samples) tumors treated with anti-PD1 (10 mg/kg). a Percentages of CpG sites methylation and b heatmap of top 10 hypomethylated (green) and 10 hypermethylated (red) genes in 344SQP (n = 2 biologically independent samples) and 344SQR (n = 2 biologically independent samples) tumors treated with anti-PD1(10 mg/kg). The methylation percentages for CpG sites were calculated by the bismark_methylation_extractor script from Bismark and an in-house Perl script. the differential methylation on CpG sites was statistically assessed by R/Bioconductor package methylKit (version 0.9.5). The CpG sites with read coverage ≥20 in all the samples were qualified for the test. The significance of differential methylation on gene level was calculated using Stouffer’s z score method by combining all the qualified CpG sites inside each gene’s promoter region (defined as −1000bp to +500 of TSS), and was corrected to FDR by Benjamini & Hochberg (BH) method. c Pyrosequencing methylation assay with specific primers for BMP7 CpG in 344SQP (n = 2 biologically independent samples with three technical replicates for each sample) and 344SQR (n = 2 biologically independent samples with three technical replicates for each sample) tumors treated with anti-PD1(10 mg/kg). Box-and-whisker plots show the minimum and maximum values. d Quantitative polymerase chain reaction (PCR) analysis of BMP7 expression in 344SQP (n = 4 biologically independent samples with two technical replicates for each sample) and 344SQR (n = 5 biologically independent samples with two technical replicates for each sample) tumors treated with anti-PD1 (10 mg/kg). ACTB expression was used as a housekeeping gene for quantitative PCR analysis. The comparative Ct method was used to calculate the relative abundance of mRNAs compared with ACTB expression. Box-and-whisker plots show the minimum and maximum. **p = 0.0159, two-sided Mann–Whitney test. e Enzyme-linked immunosorbent assay of BMP7 levels in serum from mice bearing 344SQR (n = 3 biologically independent samples with two technical replicates for each sample) or 344SQP (n = 3 biologically independent samples with two technical replicates for each sample) tumors treated with anti-PD1(10 mg/kg). Box-and-whisker plots show the minimum and maximum. **p = 0.0080 unpaired, two-sided t tests. f Enzyme-linked immunosorbent assay for BMP7 in pretreatment plasma collected from patients with disease that progressed (PD) (n = 5 biologically independent samples) on pembrolizumab (NCT02444741; NCT02402920) versus patients with progressive response (PR) or stable disease (SD) (n = 4 biologically independent samples). Box-and-whisker plots show the minimum and maximum. *p = 0.0317, two-sided Mann–Whitney test. g Representative images of immunohistochemical stains of BMP7 expression in formalin-fixed paraffin-embedded tissue sections from 344SQP and 344SQR tumors treated with anti-PD1. Data shown are representative of two reproducible independent experiments. Scale bar, 100 μm (×40 magnification). h–j Representative images of immunohistochemical stains of BMP7 expression in formalin-fixed paraffin-embedded tissue sections collected from patients with NSCLC, adrenocortical carcinoma, and mixed Mullerian carcinoma before and at the time of disease progression on pembrolizumab or ipimilumab. Data shown are representative of two reproducible independent experiments. Scale bar, 100 μm (×40magnification).

