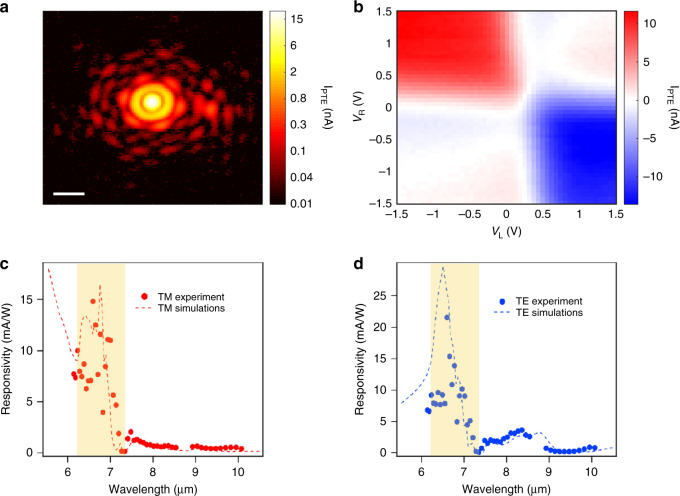
Fig. 2. Photocurrent generation and spectral photoresponse.
a Scanning photocurrent map (log scale) across the mid-IR beam focus at λ = 6.6 μm. The white scale bar corresponds to 20 μm. We obtain a FWHM of 6.1 μm. We use a small input power (Pin) of 13.7 μW (irradiance of 0.2 μW/μm2). b Photocurrent map as a function of the two gate voltages at λ = 6.6 μm. c Experimental (dots) and theoretical (dashed lines) spectral external responsivity of the device for TM-polarization and (d) for TE-polarization. The highlighted region corresponds to the hBN RB (λ = 6.2–7.3 μm). For (c and d), we set the gate voltages to a pn-junction configuration close to the optimal with VL = 0.5 V (97 meV) and VR = −0.5 V ( −100 meV). We use the same doping level for the theoretical simulations.

