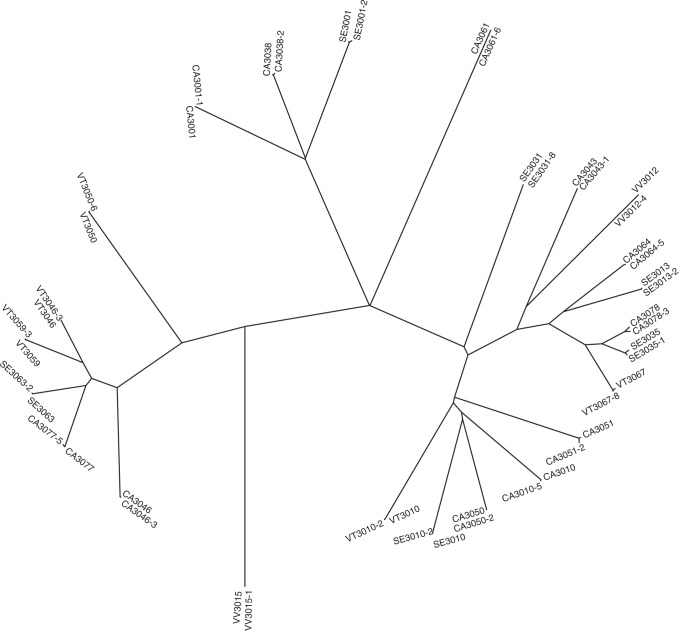
Fig. 2. Phylogenetic relationship between M. tuberculosis isolates included in the study.
Neighbor joining tree constructed using pairwise SNP differences between all 48 isolates (24 IC and 24 HHC) is shown. The IC and HHC in each TB pair cluster together with the number in parenthesis denoting their SNP difference. The SNP differences between IC–HHC TB pairs ranged from 0 to 13. In contrast, any two unrelated M. tuberculosis isolates differed, on average, by 559.6 SNPs. Source data are provided as a Source Data file.

