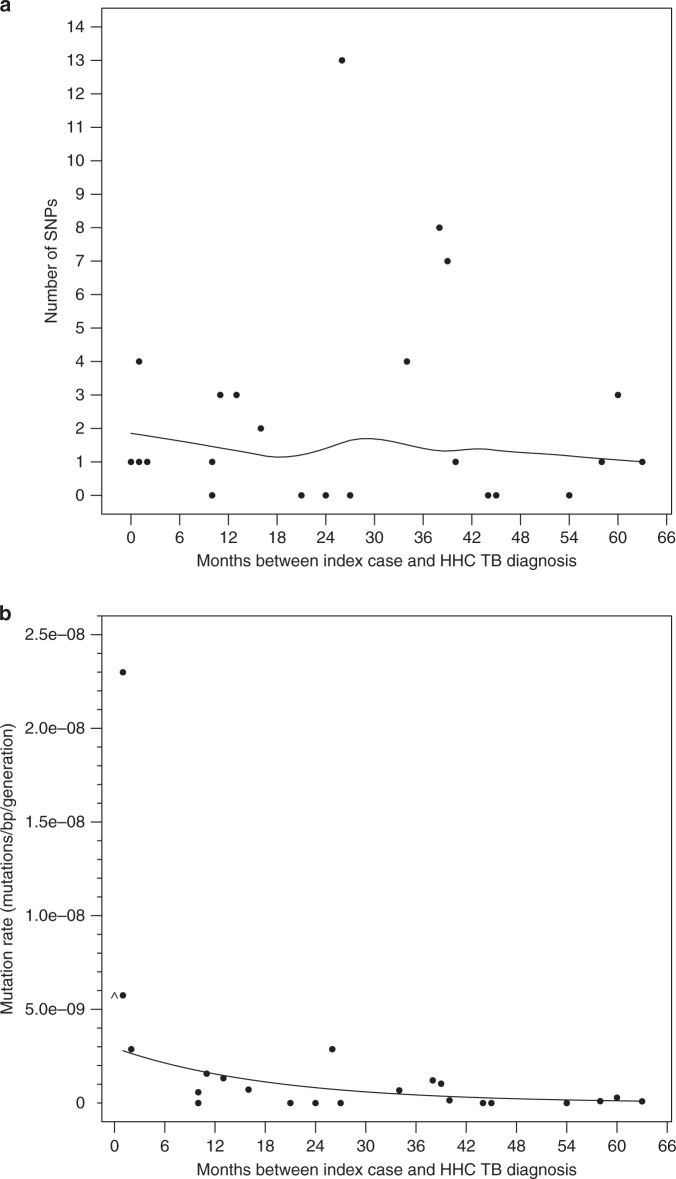
Fig. 3. Mutation accumulation and mutation rate versus generation time during latency.
a Scatter plot showing the number of SNPs that differed between the n = 24 IC and the HHC isolate pairs (y-axis) as a function of the duration of M. tuberculosis latency (x-axis). The curve through the points was estimated using a loess local regression with a second degree polynomial and symmetric re-descending M estimator with Tukey’s biweight function. b Mutation rate as a function of latency duration (months between IC and HHC TB diagnosis). The generation time is held constant at 18 h as seen in actively replicating M. tuberculosis in vitro. The smooth line shows the Poisson regression fit to the number of SNPs using t, the observed latency period in months, as the independent variable for each participant using an offset N×(t/g), where N is 0.973×genome size and t/g is the number of generations and g is set to 18 h. The coefficient for t was estimated to be −0.053 (95% confidence interval: −0.078, −0.029) and was significantly different from 0.0 (two-sided p < 0.001). The point where the month between IC and HHC TB diagnoses was 0 was set to 1 month when fitting the model in order for it to contribute to the Poisson model and as is displayed as at month 0 as ^. Source data are provided as a Source Data file.

