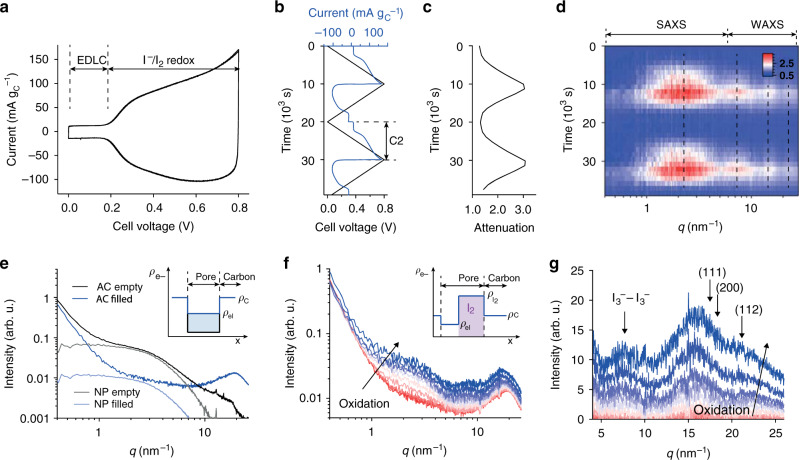
Fig. 2. In situ small and wide-angle X-ray scattering.
a Current voltage curve of the asymmetric in situ SAXS/WAXS cell at a scan rate of 0.08 mV s−1. b Current and cell voltage as a function of time for two full cycles. c The corresponding X-ray attenuation (negative logarithm of X-ray transmission42) versus time. d Relative scattering intensity change as a function scattering vector length q and time. e Ex situ SAXS/WAXS intensity versus scattering vector length q of the empty activated carbon electrode and the same electrode filled with electrolyte. Nanopore (NP) scattering intensities, obtained by subtracting the particle scattering intensity and the electrolyte structure factor (Supplementary Fig. 8), are given in gray and light blue. The inset schematically shows the electron (scattering length) density contrast between carbon skeleton and pore. f SAXS/WAXS intensities versus scattering vector length q during positive polarization. Color changes from red to blue with increasing cell voltage. The inset schematically shows electron (scattering length) density contrasts between carbon skeleton, electrolyte-filled pore and solid (crystalline) iodine. The scattering length densities of iodine, carbon and electrolyte are assumed with 3.49 × 1011 cm−2, 1.61 × 1011 cm−2, and 1.01 × 1011 cm−2, respectively. g The corresponding WAXS intensities during positive polarization, after subtracting the electrolyte structure factor contribution at 0 V cell voltage. I2 crystal diffraction peak positions are indicated, (111) at 25.1 nm−1, (200) at 29.0 nm−1, and (220) at 41.0 nm−1.

