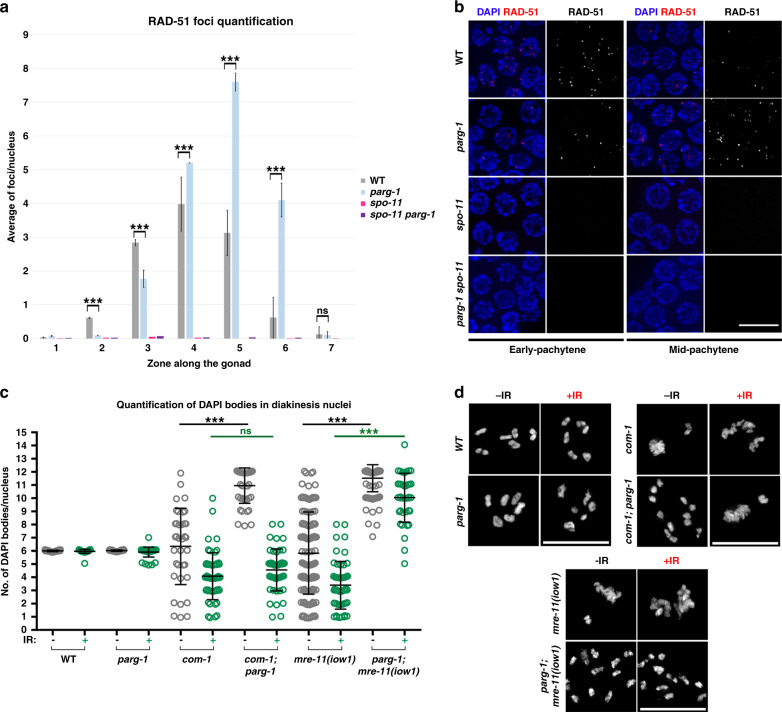
Fig. 3. Elimination of parg-1 function suppresses chromosome abnormalities in resection-defective mutants.
a parg-1 mutants display SPO-11-dependent accumulation of RAD-51 foci. Error bars represent S.E.M. Asterisks indicate statistical significance assessed by unpaired t test (***=p < 0.0001 and “ns” indicates not significant). Analysis was performed in at least three gonads for each genotype. Number of nuclei analysed for each genotype (from zone 1 to 7 respectively): WT (200, 205, 127, 181, 162, 170, 90); parg-1(gk120) (191, 256, 248, 177, 158, 126, 135); spo-11 (242, 236, 221, 204, 159, 158, 96); spo-11 parg-1(gk120) (205, 218, 203, 188, 135, 105, 81). b Representative examples of cells at different stages of the same genotypes analysed in (a). Scale bar 5 μm. c Analysis of diakinesis nuclei in different genotypes before and 27 h after exposure to IR. Error bars represent standard deviation. Center of error bars indicates mean. Statistical analysis was performed with two-tailed nonparametric Mann–Whitney test. (***p < 0.0001 and ns indicates not significant differences). Number of nuclei analysed at 0 and 10 Gy respectively: WT (35–94), parg-1(gk120) (33–88), com-1 (37–55), com-1; parg-1 (42–48), mre-11 (124–52), parg-1; mre-11 (110–40). d Representative images of diakinesis nuclei of the same genotypes scored in (c). Scale bar 5 μm.

