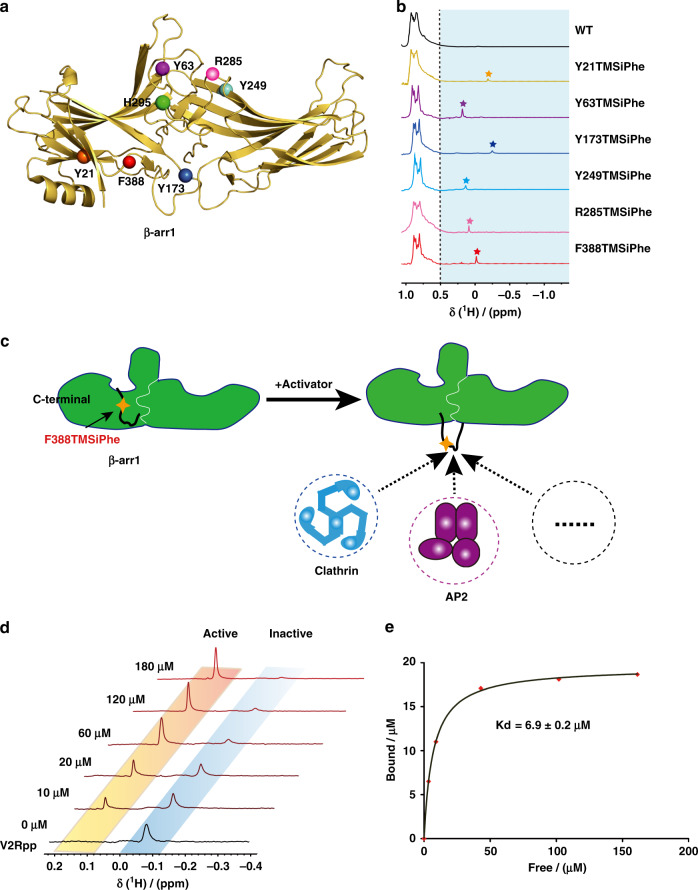
Fig. 3. Incorporation of TMSiPhe at functionally relevant motifs of β-arr1.
a Frontal view of the TMSiPhe incorporation sites depicted by spheres in the active β-arr1 crystal structure (PDB: 4JQI). Orange, Y21 in the three elements; purple, Y63 in the finger loop; blue, Y173 in the hinge region; cyan, Y249 in β-strand XVI; pink, R285, green, H295 in the lariat loop; red, F388 in the C-terminal swapping segment. b 1D 1H NMR spectra of β-arr1 labeled as described in (3a). The spectra were recorded in a buffer containing 50 mm Tris-HCl (pH = 7.5 and 150 mm NaCl at 25 °C using a Bruker 950 MHz NMR spectrometer. The protein concentrations were 5~15 μm, and the total recording time per spectrum was 6~15 min. The chemical shift for the TMSiPhe protein was less than 0.55 ppm. The pentagrams: the position of NMR signal peak for the β-arr1 inserted TMSiPhe at different sites. Orange: Y21; purple, Y63; blue, Y173; cyan, Y249; pink, R285; red, F388. c Cartoon illustration of the activation of β-arr1 and movement of the C-terminal swapping segment of β-arr1. In response to the binding of an activator, such as the phospho-vasopressin receptor C-tail (V2Rpp), the originally embedded C-terminal swapping segment of β-arr1 became highly solvent exposed, thus favoring binding to downstream signaling proteins, for example, clathrin or AP2 (adaptor protein 2). This conformational transition could be monitored by incorporation of TMSiPhe at the F388 position of β-arr1. d 1D 1H-NMR spectra of β-arr1 F388-TMSiPhe in response to titration with V2Rpp. Two distinct peaks were observed. The peak (−0.05 ppm), representing the inactive state gradually decreased in intensity, while the peak representing the active state (0.15 ppm) steadily increased in intensity. The spectra were recorded in a buffer containing 50 mm Tris-HCl (pH = 7.5) and 150 mm NaCl at 25 °C using a Bruker 950 MHz NMR spectrometer. e Analysis of the titration experiments monitored by 1D 1H-NMR spectroscopy of β-arr1-F388 TMSiPhe (3d). The curve was fitted to the nonlinear regression equation y = Bmax[X]/(Kd + [X]), according to the scatchard plot analysis (Supplementary Fig. 12). The Kd value was calculated at 6.9 ± 0.2 μm (R2 = 0.99).

