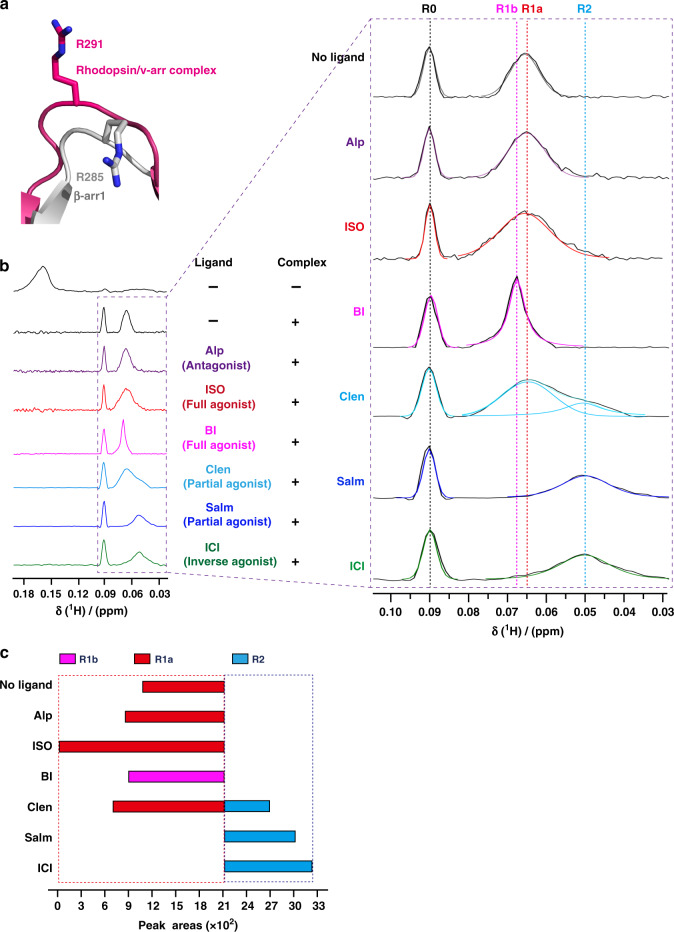
Fig. 6. Monitoring the conformational states of site 285 of β-arr1.
a Structural comparison of the R285 position in inactive β-arr1 (PDB: 1G4M) and the corresponding R291 position in the rhodopsin/arrestin complex (PDB: 5W0P). The active β-arr1 structure is depicted in gray, and the rhodopsin/arrestin complex is in red. The activation of arrestin by a receptor led to a highly solvent-exposed configuration at the R285 position of β-arr1, as suggested by the crystal structures. b 1D 1H NMR spectra of β-arr1 R285TMSiPhe activated by ppβ2V2R with or without different ligands. After incubation with ppβ2V2R, multiple new NMR signals appeared between 0.04 ppm and 0.10 ppm, which are designated as R0 (0.09 ppm), R1a (0.065 ppm), R1b (0.068 ppm), R2 (0.05 ppm), from low field to high field. The buffer used for the experiment contained 20 mm HEPES, 150 mm NaCl, 0.01% LMNG, 0.002% CHS, and 10% D2O (pH = 7.5 at 25 °C). +: receptor-β-arr1 complex; −: β-arr1 alone. c Bar graph representing the population (simulated peak area) of each NMR peak for each ligand condition. The values are also tabulated in Supplementary Fig. 26.

