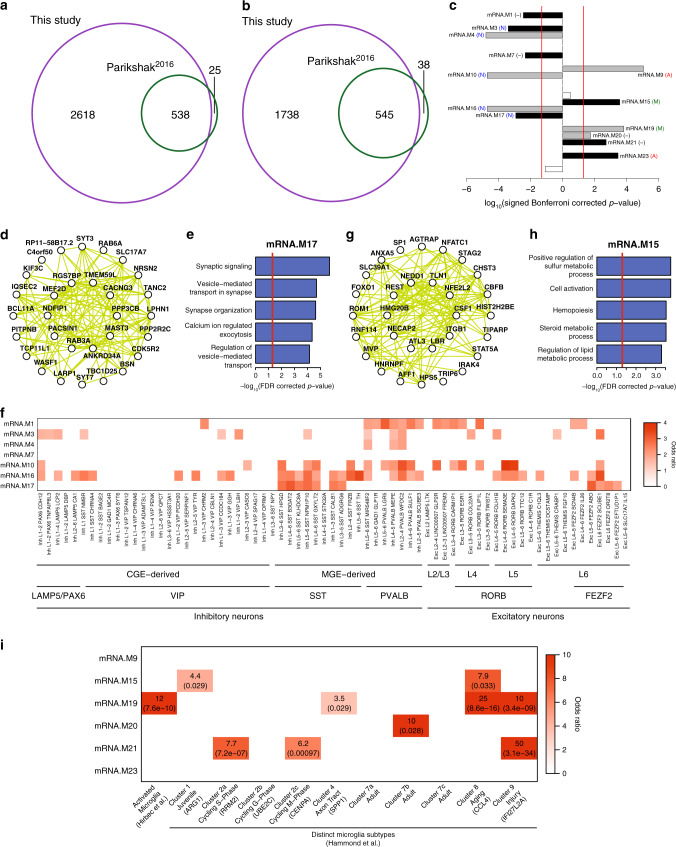
Fig. 2. mRNA expression differences in ASD.
a Overlap in ASD downregulated genes identified in this study with Parikshak et al.9. b Overlap in ASD upregulated genes identified in this study with Parikshak et al.9. c Signed association of mRNA co-expression module eigengenes with diagnosis (Bonferroni-corrected p-value from a linear mixed effects model, see Supplementary Fig. 7e). Positive values indicate modules with an increased expression in ASD samples. Gray and black bars with labels signify ASD-associated modules identified in Parikshak et al., and those additionally identified in this study, respectively. Cell type enrichment for each module is shown in parenthesis: neuron (N), astrocyte (A), microglia (M), and no enrichment (−) (see Supplementary Fig. 7g). d Top 30 hub genes and 300 connections for co-expression module mRNA.M17. e Top gene ontology enrichments for co-expression module mRNA.M17. Ontology enrichments were calculated by g:Profiler with FDR corrected p-values. f Enrichment of ASD downregulated neuronal co-expression modules with neuronal cell-type markers identified from single-nuclei RNA sequencing22. Enrichments were calculated using a logistic regression model and p-values were adjusted for multiple testing using FDR correction. Only those enrichments with odds ratio >1 and FDR corrected p-value < 0.05 are shown. g Top 30 hub genes and 300 connections for co-expression module mRNA.M15. h Top gene ontology enrichments for co-expression module mRNA.M15. Ontology enrichments were calculated by g:Profiler with FDR corrected p-values. i Enrichment of ASD upregulated glial co-expression modules with microglial activated genes26 and microglial cell-type markers25. Enrichments were calculated using a logistic regression model and p-values, which are shown in parentheses, were adjusted for multiple testing using FDR correction. Only those enrichments with odds ratio >1 and FDR corrected p-value < 0.05 are shown.

