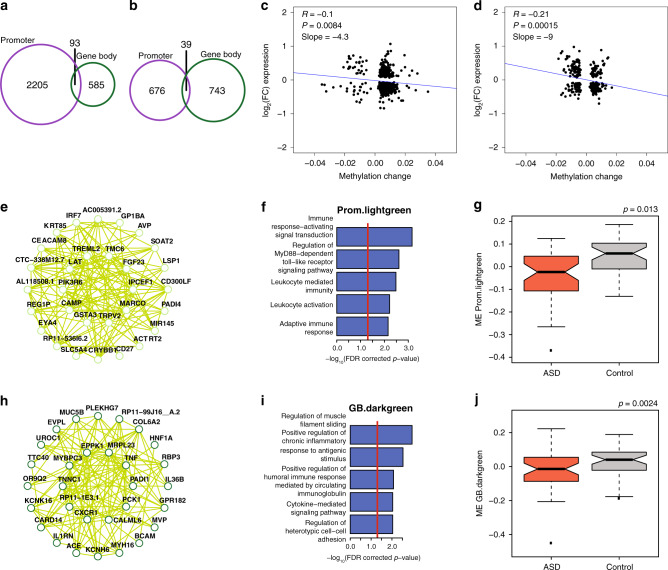
Fig. 3. DNA methylation differences in ASD.
a Overlap in ASD hypermethylated gene promoters and gene bodies. b Overlap in ASD hypomethylated gene promoters and gene bodies. c Correlation between expression and methylation changes for genes that have differential promoter methylation and are differentially expressed. A linear model was used to correlate differential expression with differential methylation. P-value is from fit of linear model. d Correlation between expression and methylation changes for genes that have differential gene body methylation and are differentially expressed. A linear model was used to correlate differential expression with differential methylation. P-value is from fit of linear model. e Top 30 hub genes and 300 connections for promoter co-methylation module Prom.lightgreen. f Top gene ontology enrichments for promoter co-methylation module Prom.lightgreen. Ontology enrichments were calculated by g:Profiler with FDR corrected p-values. g Promoter co-methylation module Prom.lightgreen eigengene values for ASD and control samples. P-value is from fit of a linear mixed effects model (see Supplementary Fig. 9f). h Top 30 hub genes and 300 connections for gene body co-methylation module GB.darkgreen. i Top gene ontology enrichments for gene body co-methylation module GB.darkgreen. Ontology enrichments were calculated by g:Profiler with FDR corrected p-values. J Gene body co-methylation module GB.darkgreen eigengene values for ASD and control samples. P-value is from fit of a linear mixed effects model (see Supplementary Fig. 10f). For boxplots in g, j, the center of the box is the median value, the bounds of the box are the 75th and 25th percentile values, the whiskers extend out from the box to 1.5 times the interquartile range of the box, and outlier values are presented as individual points.

