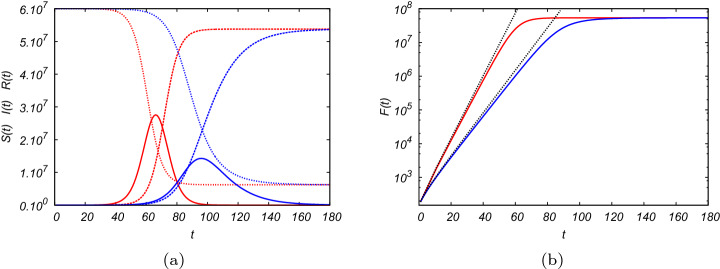
Figure 2.
(a) Number of susceptible S(t) (dotted lines), infected I(t) (solid lines), and recovered R(t) (dashed lines) persons as functions of time, for the SIR model, Eqs. (6–8) (blue lines) and for the delay model, Eqs. (11–13) (red lines), with initial conditions and , and , with parameters per unit of time and units of time (e.g. days), therefore the basic reproduction number in both the models is . (b) Total number of infected persons , in log-scale, as a function of time from the standard SIR model (blue solid line) and from the delay model (red solid line). The gray dotted lines are the analytical results from Eq. (10) for the SIR model and Eq. (25) for the delay model, valid in the first stage of the infection.

