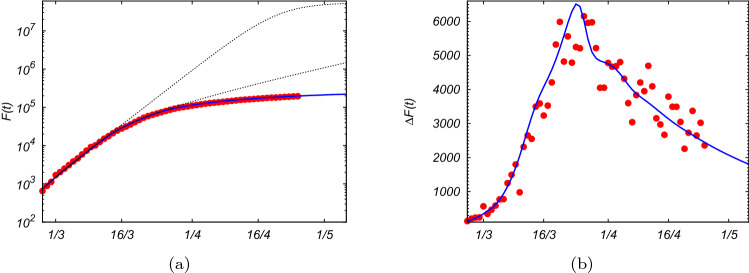
Figure 5.
(a) Total number of infected persons over time, F(t) (red points), from official data for Covid-19 in Italy12, where , up to 25th April. The blue line is the theoretical prediction F(t) as solution of Eq. (30), with initial conditions, fixed at the 21th February, , and (), and using the profile for the infection rate given by Eq. (31), with the parameters reported in Fig. 4. The gray dotted lines are the expected curves for F(t) if the first and the second containment measures (8–11th March and 22th March) had not been taken. (b) Daily number of infected persons, , compared with the theoretical result obtained performing from the solution of Eq. (30).

