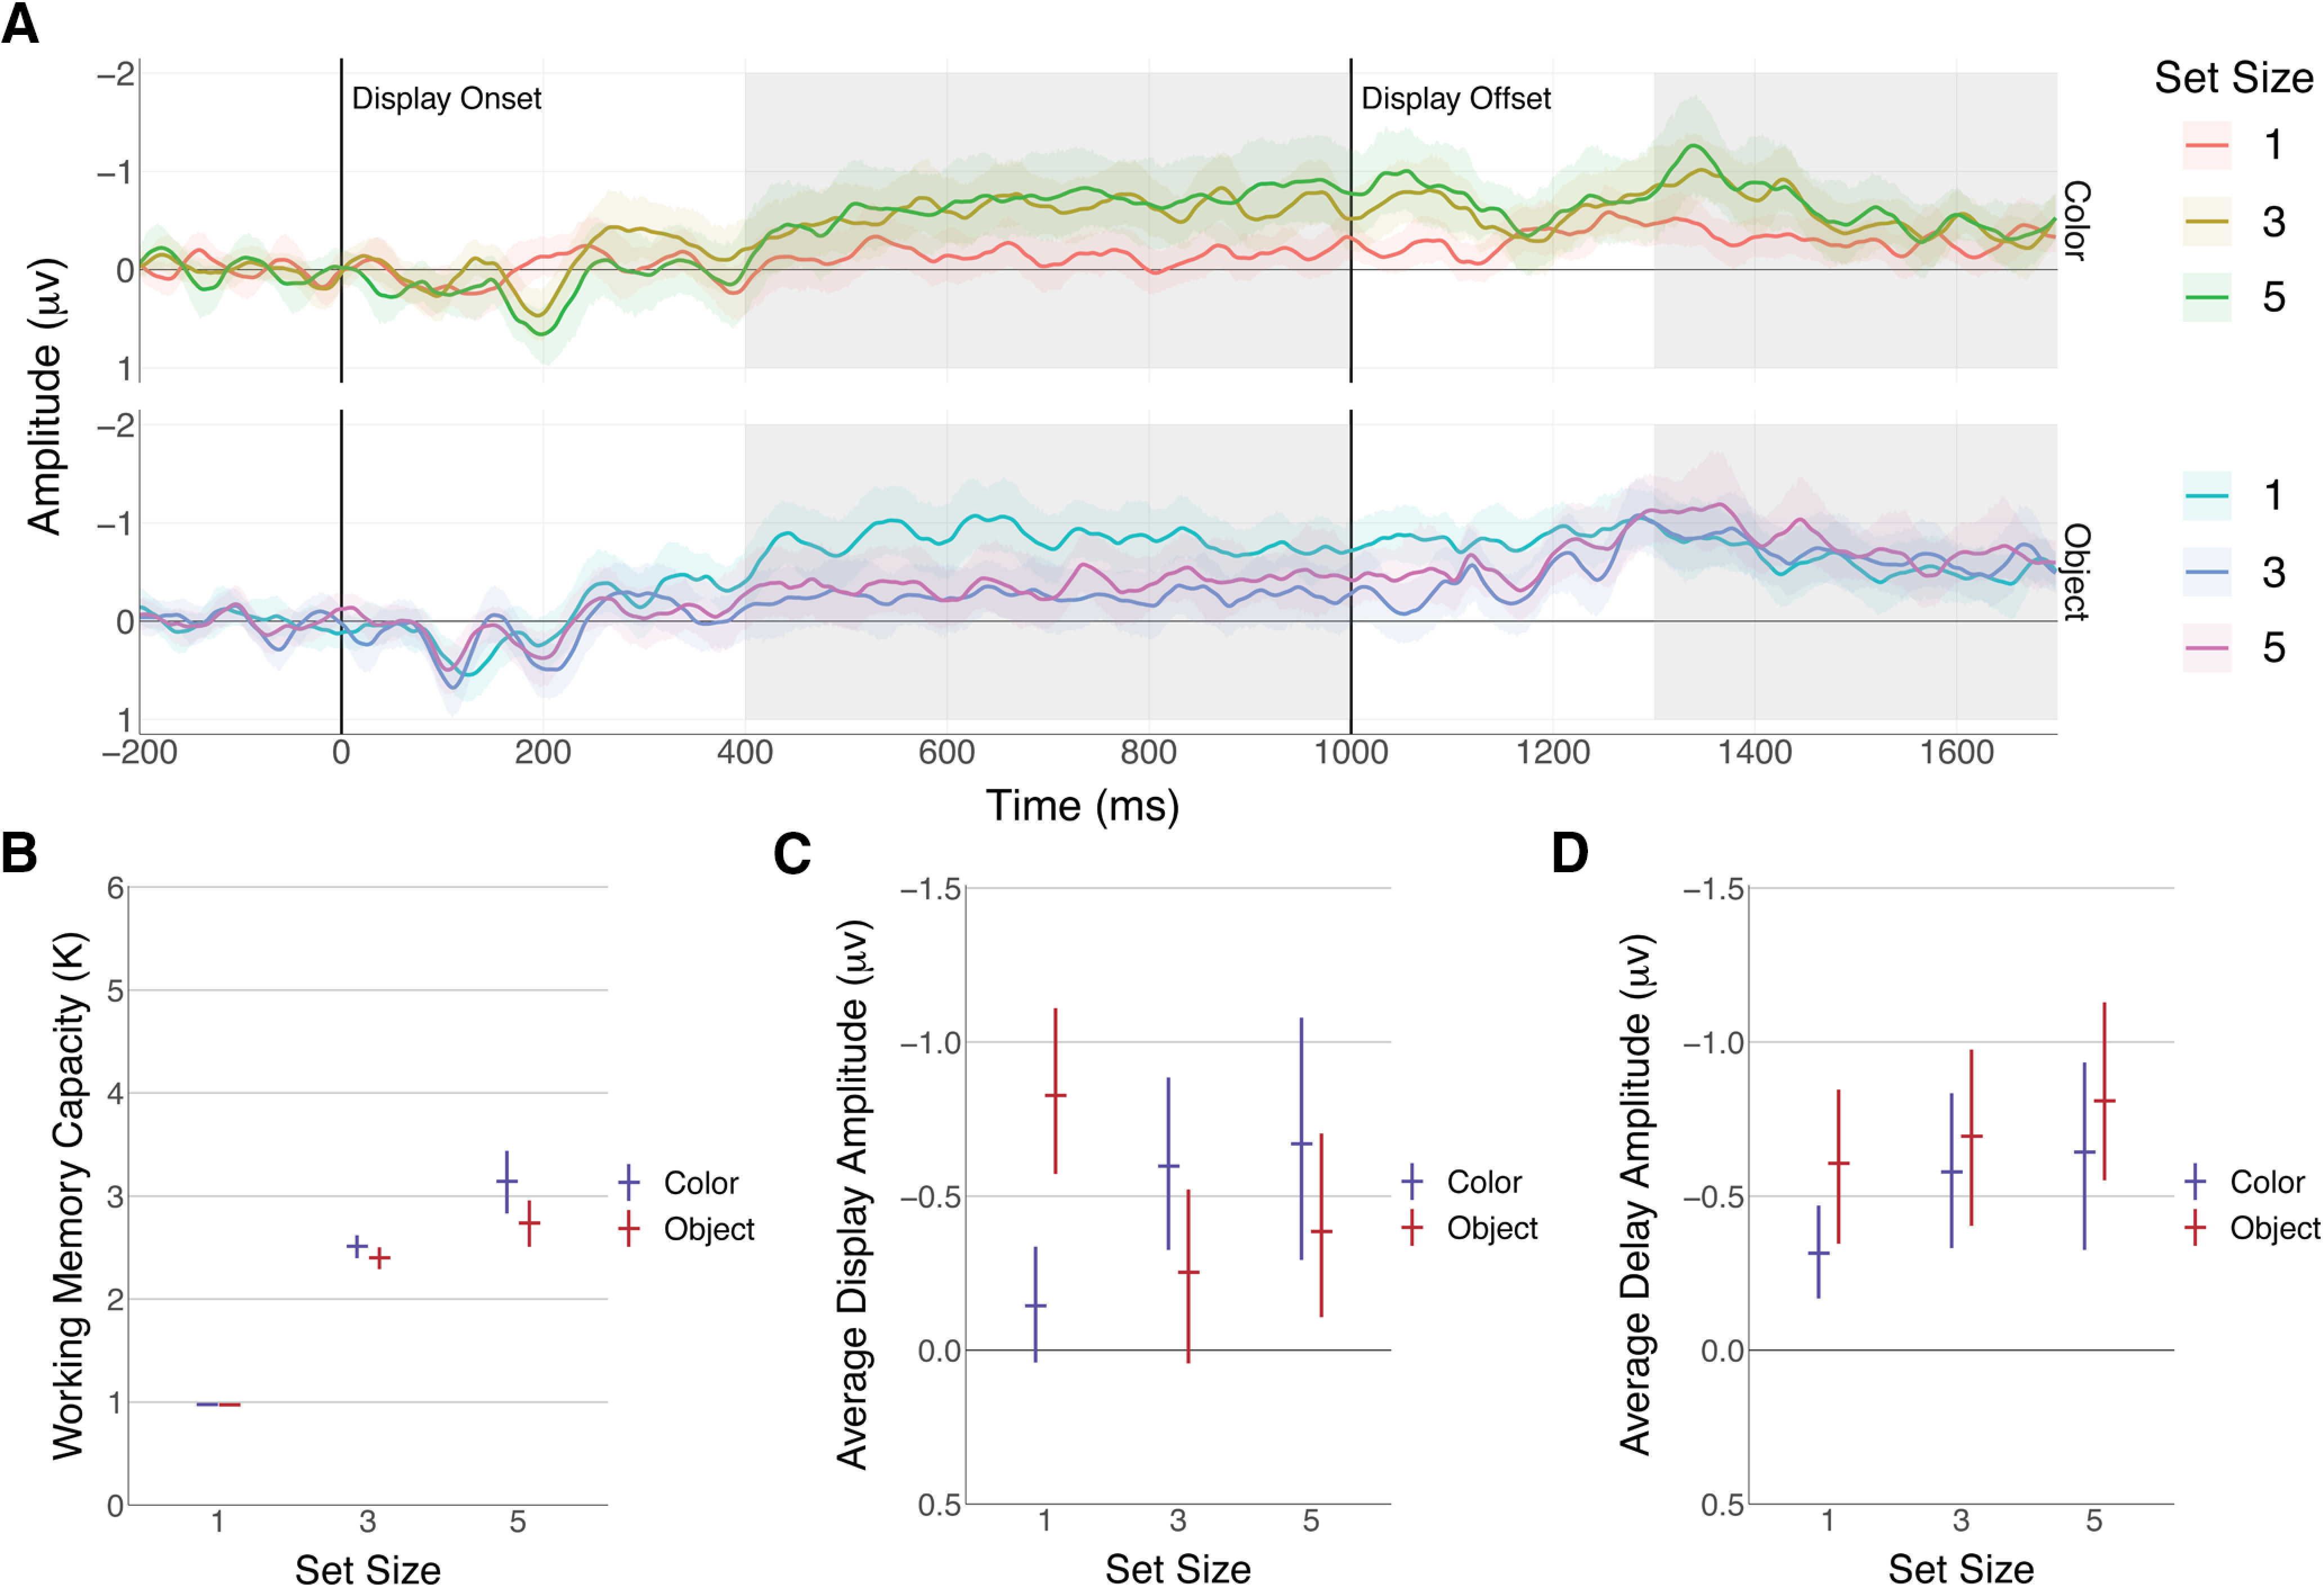
Figure 3.

CDA amplitude by set size and item type. Error bars indicate bootstrapped 95% confidence intervals. A, Raw CDA waveforms. CDA was generated by averaging over trials for each participant and calculating a contralateral minus ipsilateral difference wave using the PO3, PO4, PO7, and PO8 electrodes. Highlighted regions show the areas used to calculate mean CDA amplitudes. B, Experiment 2 behavior results. Working memory capacity was calculated using the set size for that condition. C, Mean CDA amplitude for the memory display (400–1000 ms). Means were generated for each participant before bootstrapping. D, Mean CDA amplitude for the delay (1300–1700 ms). Means were calculated using the same time window as Brady et al. (2016).
