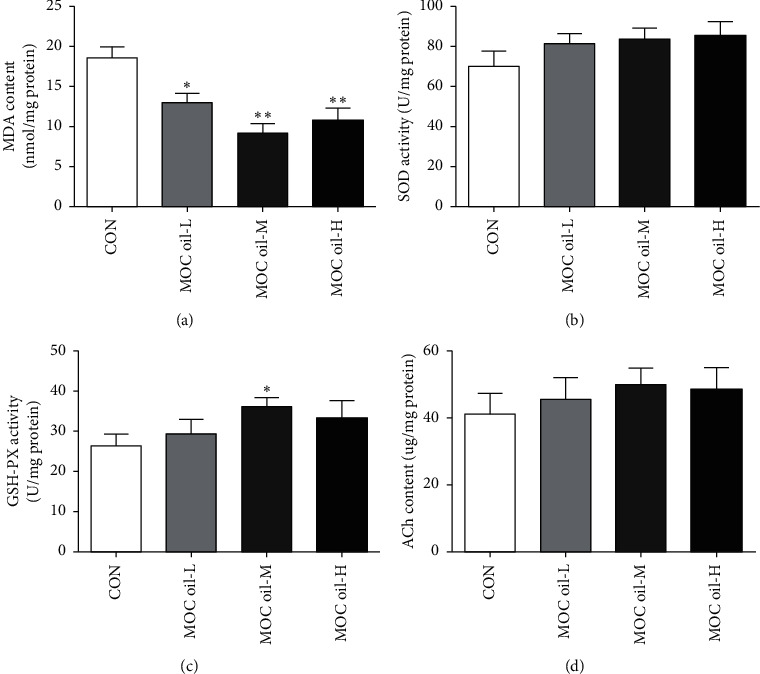
Figure 3.

(a–d) The effects of different concentrations of MOC oil treatment on the contents of MDA and ACh and the activity of SOD and GSH-PX in the hippocampus of animal models in the first stage, respectively (mean ± SEM, n = 10, ∗P < 0.05, ∗∗P < 0.01 versus control group).
