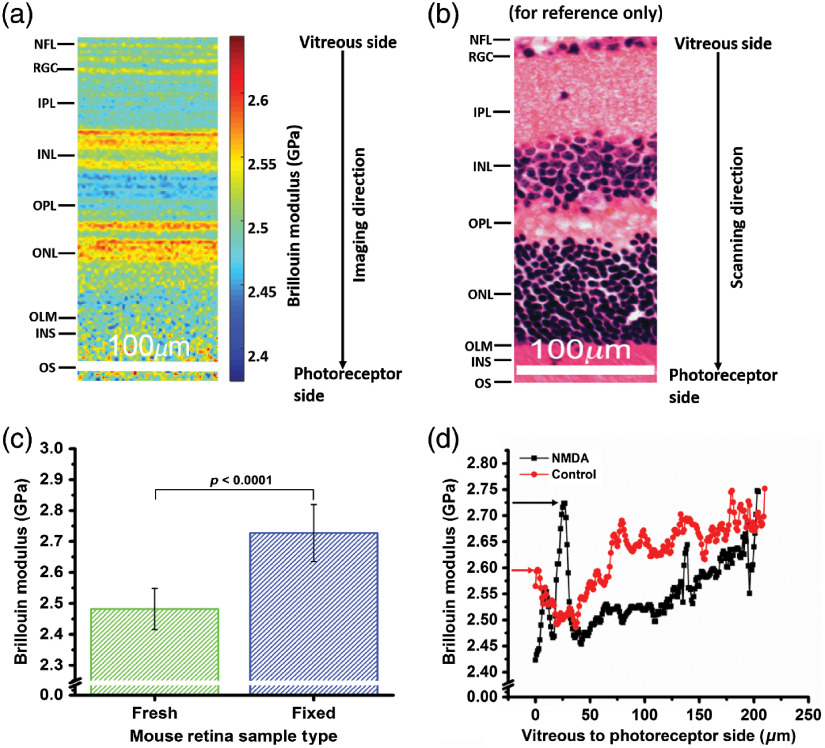
Fig. 2.
(a) Brillouin frequency-shift map of the mouse retina, (b) histology of mouse retina (for reference only), (c) average Brillouin modulus of fresh () and fixed () mouse retina samples (averaged pointwise per sample and then sample-wise per type of sample), and (d) Brillouin modulus depth profile of an NMDA-induced damaged retina and its contralateral control. Arrow indicates the RGC layer.

