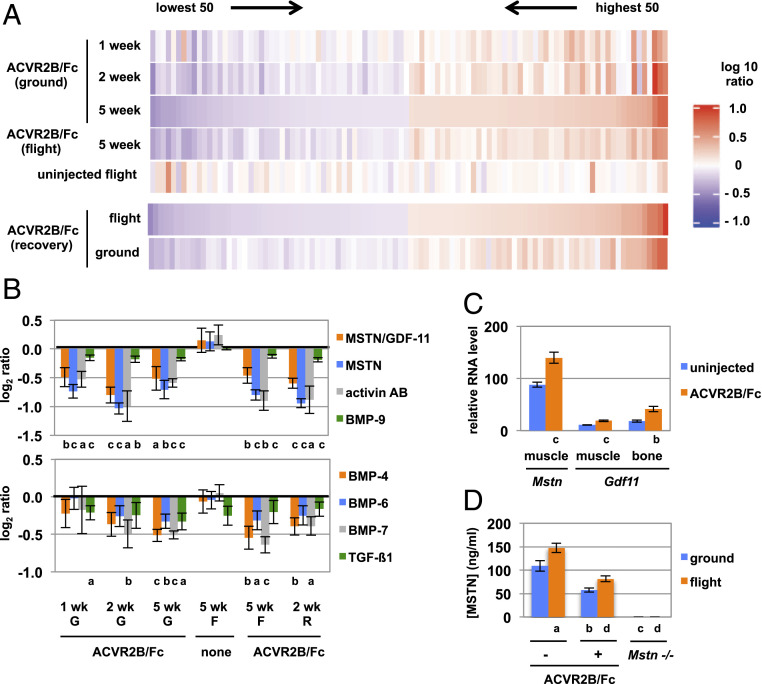
Fig. 4.
Changes in plasma protein profiles as a result of ACVR2B/Fc treatment and microgravity. (A) Heat maps showing the 50 most up-regulated and 50 most down-regulated proteins identified by SomaScan analysis and sorted by ACVR2B/Fc-treated versus uninjected ground mice at 5 wk (Upper group of 5 heat maps) or by ACVR2B/Fc-treated versus uninjected flight mice during the 2-wk recovery period after return to Earth (Lower group of two heat maps). (B) Differences in plasma levels of TGF-β family members. Numbers indicate log2 of the ratios of protein levels determined by SomaScan analysis in ACVR2B/Fc-treated versus uninjected mice or flight versus ground uninjected mice. (C) Relative RNA levels of Mstn and Gdf11 in muscle and/or bone determined by RNAseq analysis. (D) Plasma concentrations of MSTN determined by ELISA. G, ground; F, flight; R, recovery. a P < 0.05, b P < 0.01, c P < 0.001 versus uninjected ground mice; d P < 0.001 versus uninjected flight mice.

