Fig. 2.
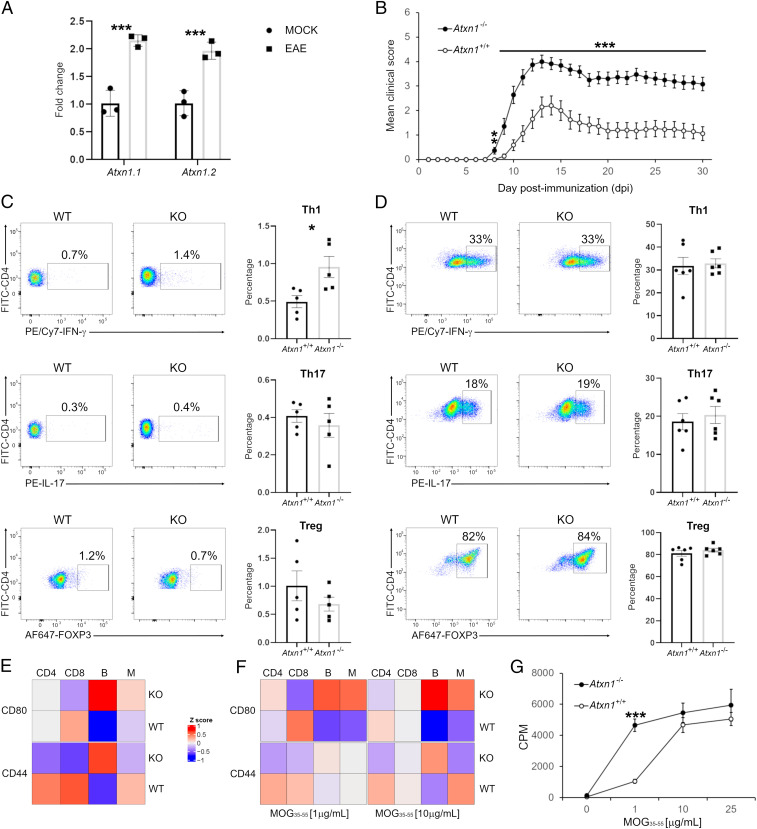
Ataxin-1 regulates the immune response. (A) All Atxn1 variants are up-regulated in spleens of EAE mice (20 dpi) as compared to controls (n = 3 mice per group). (B) Adoptive transfer of Atxn1−/− splenocytes drives a more severe passive EAE as compared to Atxn1+/+ cells (n = 18 knockout mice, n = 17 wildtype mice). (C) A higher percentage of Th1 cells was measured in Atxn1−/− splenocytes from MOG peptide-primed mice restimulated in vitro (n = 5 mice per group). (D) Similar percentages of Th1, Th17, and Treg cells were measured for both genotypes in pure cultures of naïve CD4+ T cells (n = 6 mice per group). (E) Surface levels of CD44 and CD80 were assessed in naïve splenocytes. In the heatmap, each column represents the mean of all mice in the group for each cytotype and each row the levels of a specific marker. The levels of both markers are increased in knockout B cells (PCD44 = 0.003; PCD80 = 0.0006) while CD44 is more expressed in wildtype CD4+ (P = 0.05) and CD8+ (P = 0.009) cells (n = 11 mice per group). (F) CD44 and CD80 surface levels were measured in splenocytes from MOG peptide-primed mice and restimulated in vitro. Higher levels of CD80 were detected in knockout B cells (PMOG1 = 0.01; PMOG10 = 0.002) and monocytes (PMOG1 = 0.03; PMOG10 = 0.05) (n = 8 mice per group). (G) Naïve CD4+ T cells from 2D2 mice were cocultured with B cells in the presence of increasing concentrations of MOG peptide. Knockout B cells showed increased antigen presenting activity as demonstrated by higher T cell proliferation rates (n = 3 mice per group). Differences between groups were assessed by two-tailed Student’s t test. *P ≤ 0.05, **P ≤ 0.01, ***P ≤ 0.001.

