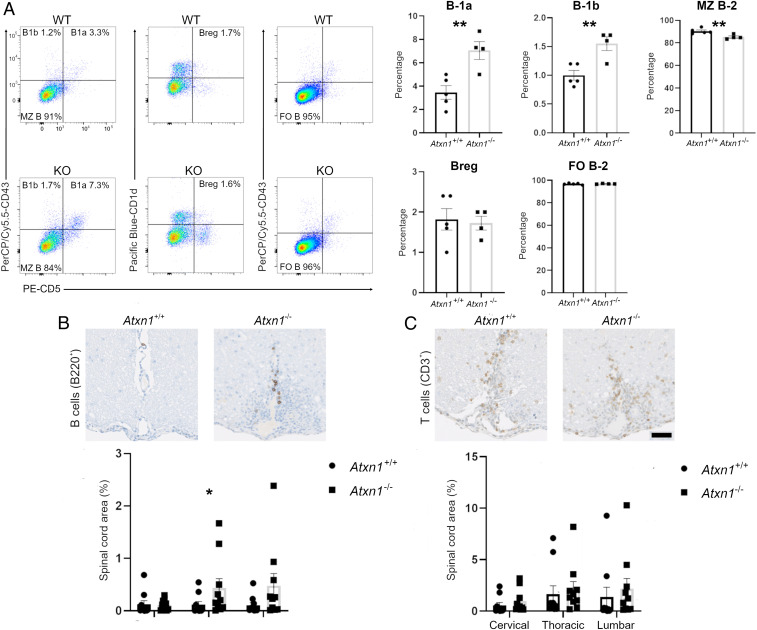
Fig. 3.
Ataxin-1 controls the functions of the B cell compartment. (A) Splenocytes from Atxn1−/− and wildtype mice were analyzed by flow cytometry for different CD19+ B cell subpopulations. A significant increase was measured for the percentage of B-1a [CD5+,CD43+,IgMhigh, immunoglobulin D (IgD)low] and B-1b (CD5−,CD43+,IgMhigh,IgDlow) subsets in knockout animals as compared to controls, while marginal zone B-2 cells (CD5−,CD43−,IgMhigh,IgDlow) were significantly decreased. No differences were instead measured in the size of regulatory (CD5+,CD43−,IgMhigh,IgDlow) and follicular B-2 (CD5−,CD43−,IgMlow,IgDhigh) cell populations between the two genotypes (n = 4 to 5 mice per group). (B) Histological analysis of B cell infiltration into the spinal cord of Atxn1−/− and wildtype mice upon EAE. Paraffin-embedded sections from spinal cords (cervical, thoracic, and lumbar regions) were collected at EAE onset (10 dpi) and stained for B cells using an antibody for B220. Digital images were then acquired and B cell infiltration was measured as the area positive to B220 stain relative to the total area of the spinal cord section. A significant increase in infiltrating B cells was quantified in the thoracic region of Atxn1−/− mice (n = 10 mice per group). (C) T cell infiltration was similarly assessed using an antibody for CD3. No significant differences were detected between genotypes (n = 10 mice per group). Scale bar: 50 μm. Differences in the size of cell populations were assessed by two-tailed Student’s t test while differences in cell infiltration were assessed by one-tailed Student’s t test. *P ≤ 0.05, **P ≤ 0.01.

