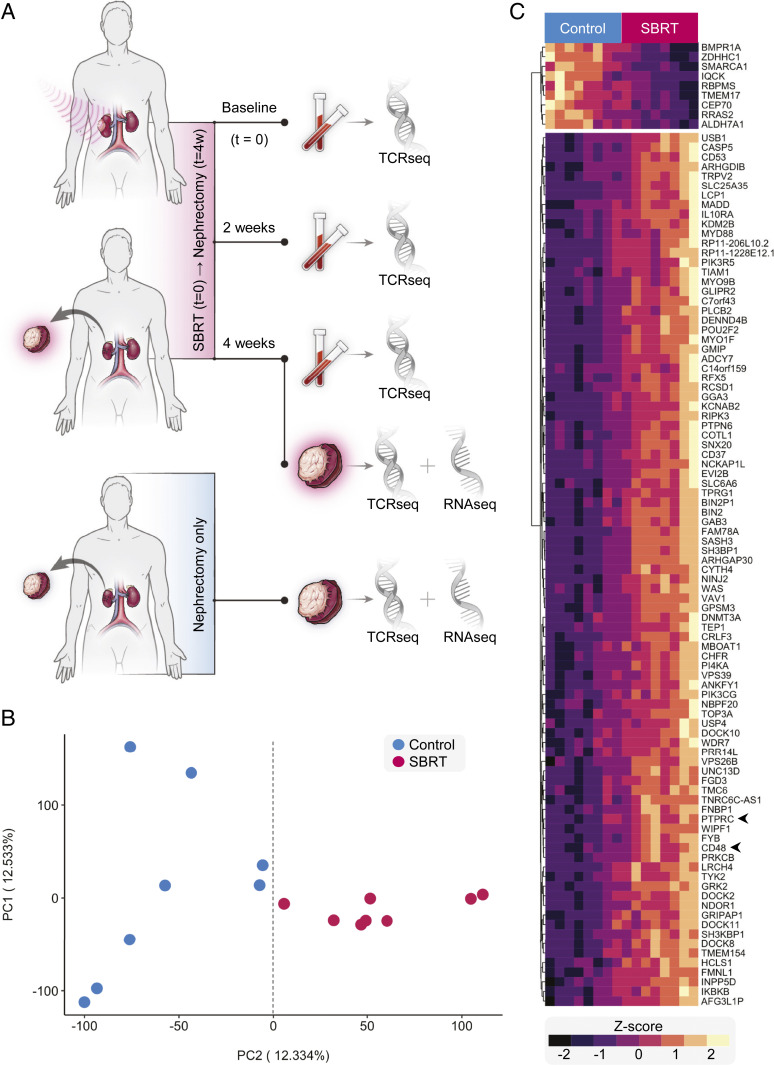
Fig. 1.
Transcriptional signature of RCC following SBRT treatment. (A) Primary tumors from RCC patients after nephrectomy-only (control) and SBRT plus nephrectomy (SBRT) specimens were processed and later analyzed by bulk RNA sequencing. (B) PCA plot of bulk RNA sequencing data from patient RCC tumors. (C) Heat map of the top-100 contributors to PC2. Genes (rows) clustered by normalized expression among patient samples. Samples (columns) are arranged according to distribution along PC2.

