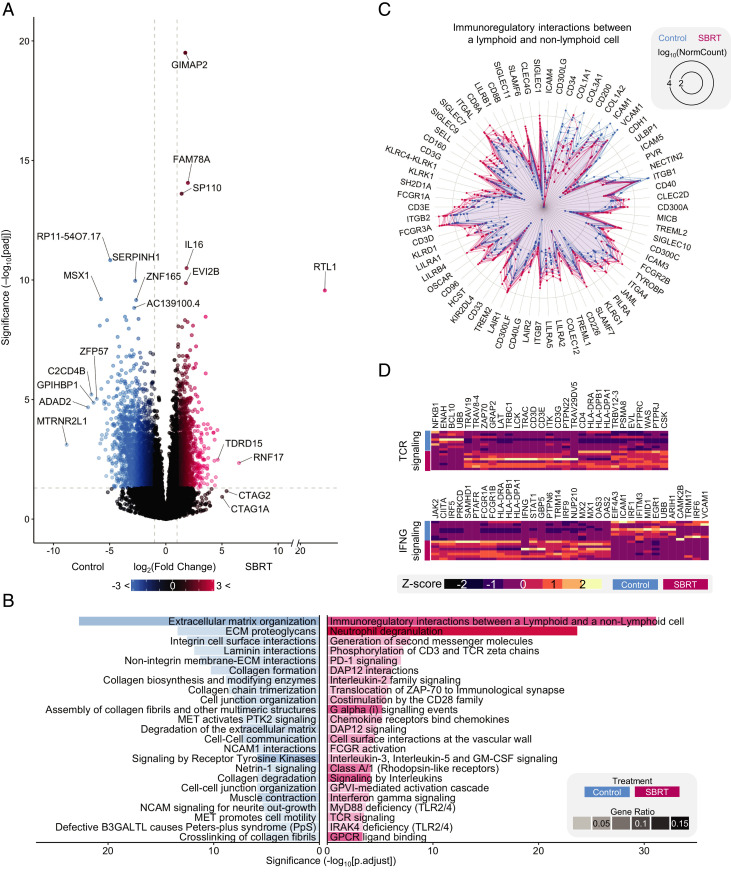
Fig. 2.
Postirradiated RCC gene expression is associated with changes to immune pathways. (A) Volcano plot showing differential expression of genes in SBRT vs. control. Significance threshold is |log2(fold change)| >1 (vertical dashed lines) and Padj < 0.05 (horizontal dashed line). Genes in black did not pass the threshold. (B) GSEA of control DE genes (Left, blue) and SBRT DE genes (Right, red). The top-23 most significant are shown. Opacity is the ratio of DE genes in the pathway to total DE genes. (C) Radar plot of immune interactions between lymphoid and nonlymphoid cells. Lines represent individual patient values for indicated DE genes. (D) Heatmaps of DE genes for TCR signaling and IFNG signaling pathways.

