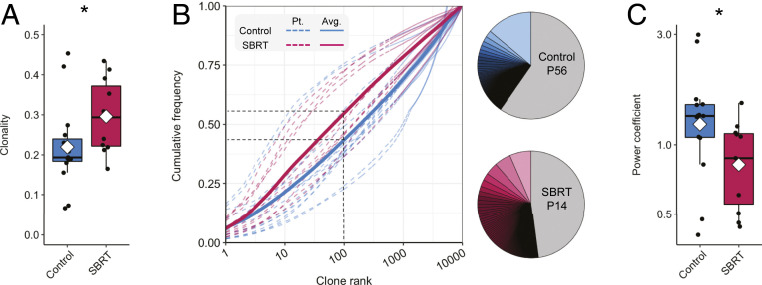
Fig. 3.
Analysis of the intratumoral T cell repertoire of nephrectomy and SBRT-treated RCC. (A) Boxplot showing T cell repertoire clonality in control and SBRT patient tumors. Per-patient values were calculated with the immunoSEQ analyzer. Dots are individual patient values; a diamond indicates the mean. (B) Cumulative frequency distributions calculated for the control and SBRT groups (control regression: 0.171 * log10rank1.193; SBRT regression: 0.283 * log10rank0.858). Black dashed lines indicate the average cumulative frequencies of the top-100 clones for SBRT and control tumor T cell repertoires. Pie charts show representative cumulative frequencies of the top-100 clonotypes in indicated patients. (C) Boxplot of nonlinear regression power coefficients by patient. *P < 0.05, Mann–Whitney–Wilcoxon two-tailed test.

