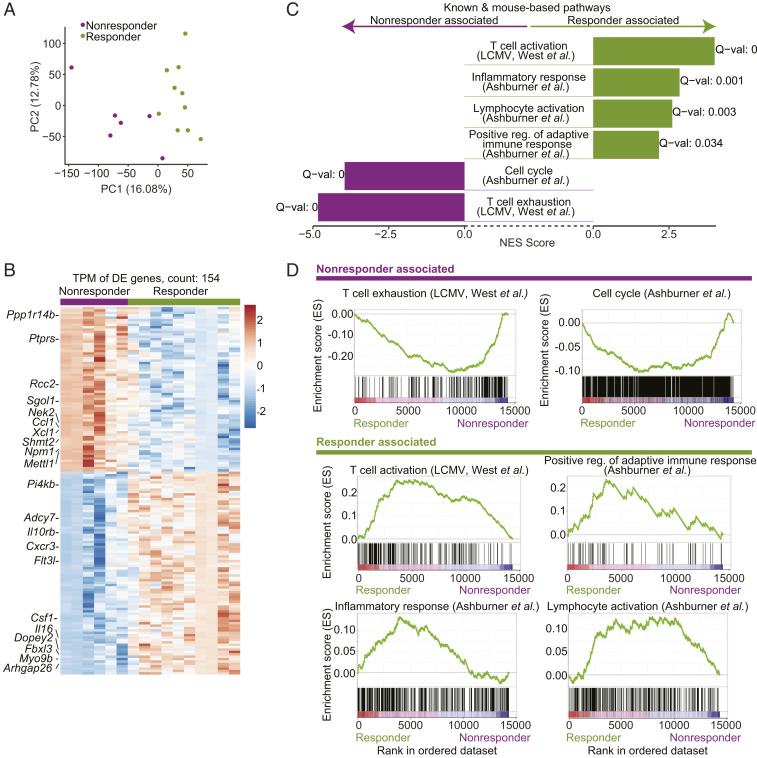
Fig. 3.
Transcriptional profiling of CD8+ TILs extracted shortly following treatment initiation yields distinct gene signatures for responders and nonresponders. CD8+ tumor-infiltrating T cells were extracted from tumors surgically removed at day 7 following anti-PD-1 therapy and response was assessed from the remaining paired tumor. (A) PCA of the transcriptional profiles of CD8+ TILs shortly following anti-PD-1 therapy (7 d) shows that the first two principal components separate responders and nonresponders. (B) A heatmap of the 154 differentially expressed genes across responders and nonresponders in CD8+ TILs shortly following anti-PD-1 therapy (7 d). (C) Transcriptional profiles of CD8+ TILs shortly following anti-PD-1 therapy are associated with T cell activation pathways in responders and with T cell exhaustion and cell cycle pathways in nonresponders (GSEA PreRanked analysis). (D) Enrichment plots as output from GSEA for pathways from C.

