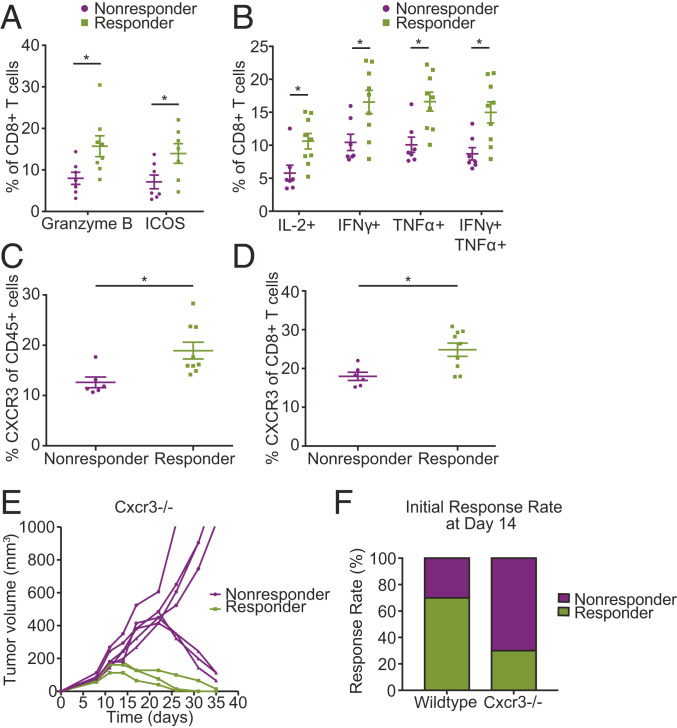
Fig. 4.
Expression of CXCR3 on T cells as a potential biomarker of response to anti-PD-1 therapy. (A and B) Flow-cytometry measurements show CD8+ T cells extracted from tumors prior to treatment initiation express higher levels of (A) markers of T cell activation and function and (B) the indicated cytokines in responders than in nonresponders; n = 6 to 9. P < 0.05 by Student’s t test. Error bars indicate SEM. (C and D) Tumors in mice that respond to anti-PD-1 treatment express higher levels of CXCR3 prior to treatment initiation; n = 6 to 9. Flow-cytometry analysis shows elevated CXCR3 levels in (C) total CD45+ cells (P = 0.012) and in (D) CD8+ T cells (P = 0.010) in tumors extracted from responder mice (by Student’s t test). Error bars indicate SEM. (E) CXCR3 deficiency results in delayed response to ICB. Tumor growth in Cxcr3−/− mice bearing orthotopic E0771 breast tumors treated with anti-PD-1 mAb on days 8, 11, and 14 following tumor inoculation. While up to day 14 posttreatment there is a clear separation between responders and nonresponders, with nonresponders consisting of 70% of the Cxcr3−/− mice, after day 14 posttreatment some of the initial Cxcr3−/− nonresponders show a delayed response to treatment; n = 10 and representative of two independent experiments. (F) Genetic deletion of Cxcr3 leads to a change in the observed response rate at day 14 following anti-PD-1 treatment initiation from 70% in WT to 30% (3/10) in Cxcr3−/− mice. (*P < 0.05) (by Student’s t test). Error bars indicate SEM; n = 10 and representative of two independent experiments.

