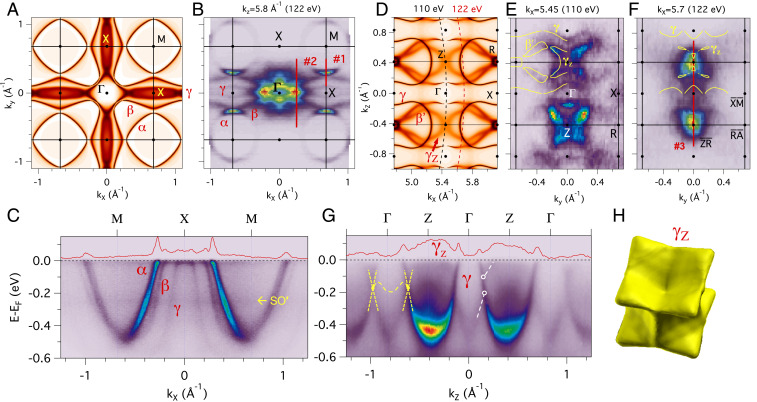
Fig. 2.
-space locations of -dependent measurements for the (001) and (100) surfaces of CeCo. (A) DMFT (T = 10 K)-calculated - FS spectral function in the plane. (B) On-resonance 122-eV ARPES (001) intensity map using linear vertical (-) polarization. (C) On-resonance 122-eV valence band dispersion image along -- (cut 1) with a Fermi-edge intensity profile (red line) and identification of a weak-intensity spin–orbit sideband excitation (SO′). (D) DMFT - FS spectral image for = 0, with the axis corresponding to ARPES (100) surface normal emission photon dependence. (E) High-symmetry 110-eV ARPES (100) intensity map imaging the , , and FS structures. (F) On-resonance 122-eV ARPES (100) intensity map highlighting hotspots at the BZ boundary and edge of the FS. DMFT (T = 10 K) FS contours are overplotted in experimental ARPES panels. Numbered red line momentum cuts correspond to -dependent measurements presented in Figs. 3 and 4. (G) High-symmetry valence band dispersion images for the (100) cleave surface at = 110 eV at normal emission. (Left, in yellow) Overplotted schematic of topological surface state dispersion (dashed) connecting single Dirac-like band dispersion (dashed) crossing points (solid), all as predicted in DFT. (Right) Locations of two separated band crossing points actually observed in experiment (white circles). Related, as discussed in text, the predicted surface state dispersion is not observed. (H) Theoretical 3D shape of the hole FS.

