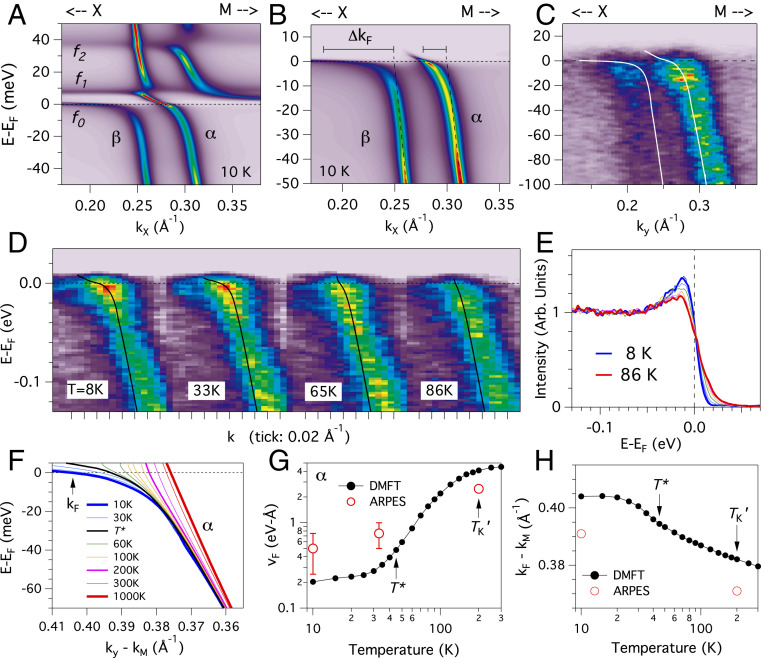
Fig. 3.
Temperature dependence of -band Ce 4 states for the CeCo (001) cleaved surface. (A and B) DMFT spectral image at 10 K for cut 1 in Fig. 2 through both and crossings without (A) and with (B) a Fermi–Dirac thermal distribution cutoff. (C) Experimental - and -band crossings at 8 K for a similar momentum cut. (D and E) ARPES dependence of the -band crossing including selected spectral images (D) and line spectra (E). (F–H) DMFT dependence of the -band dispersion (F) and quantitative analysis of the Fermi velocity (G) and Fermi momentum (H).

