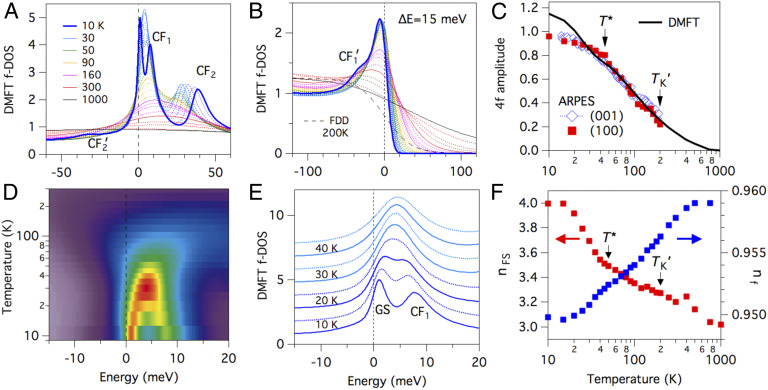
Fig. 5.
DMFT -integrated temperature dependence of Ce 4 states for CeCo. (A and B) -dependent -integrated DMFT 4-DOS spectra with (B) a Fermi-edge cutoff and experimental energy broadening of 15 meV. (C) Comparison of experimental and simulated dependences of -peak amplitudes after background subtraction. (D and E) Spectral weight image and stack plot of the -dependent merging of the ground state and first excited CEF peaks. (F) (left) dependence of the DMFT total FS volume converted to electron occupation () exhibiting an 1-electron gain at low and (right) the DMFT total localized- occupation () exhibiting a tiny 0.01-electron loss at low . Crystalline electric-field levels (CF1,2) and their crystal field sideband peaks () are labeled.

