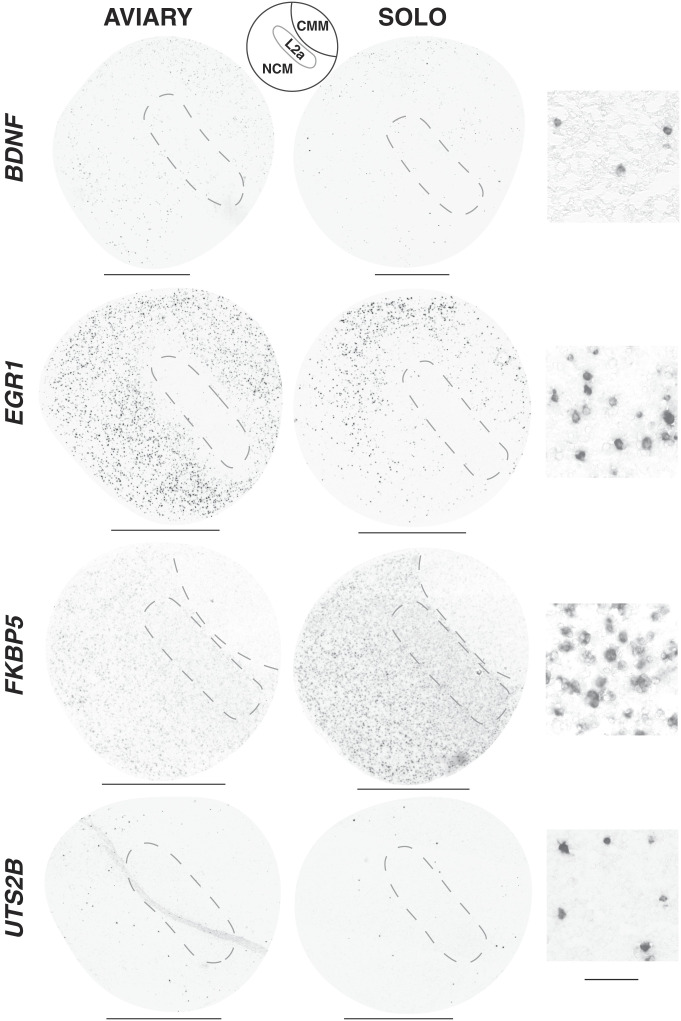
Fig. 4.
Anatomical expression patterns of mRNAs within the auditory lobule. Shown are images from in situ hybridizations with riboprobes (4 genes labeled on the Left), from adult females (2015 experiment). The AVIARY and SOLO columns show sections in the sagittal plane (0.2 to 0.5 mm from midline). (Scale bar: 1 mm.) Column 3 shows high-magnification images (40×) illustrating the cellular labeling pattern in NCM for condition of highest expression (BDNF and EGR1: AVIARY; FKBP5 and UTS2B: SOLO). (Scale bar: 50 µm.)

