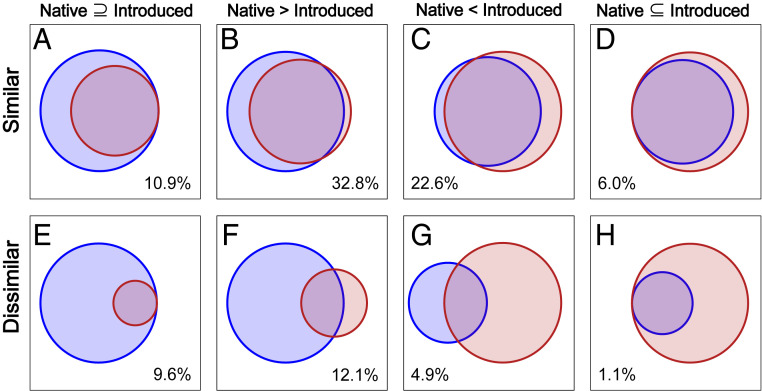
Fig. 2.
Eight simplified scenarios of changes in breadth and position between native and introduced climatic niches. In the 2D environmental space, the native niche (blue circle) could be containing (A and E), larger than (B and F), smaller than (C and G), or belonging to (D and H) the introduced niche (red circle). Two niches can occupy similar (A, B, C, and D) or dissimilar (E, F, G, and H) positions. The breadth and similarity of native and introduced niches are averaged across all species under each scenario, with the percentage showing the frequency of the scenario. Niche breadth is quantified using dynamic data from studies that estimate niche dynamics using the COUE scheme, and niche similarity is quantified using Sørensen’s similarity index. The breadth of the smaller niche is set as a proportion of the larger niche for better visualization.

