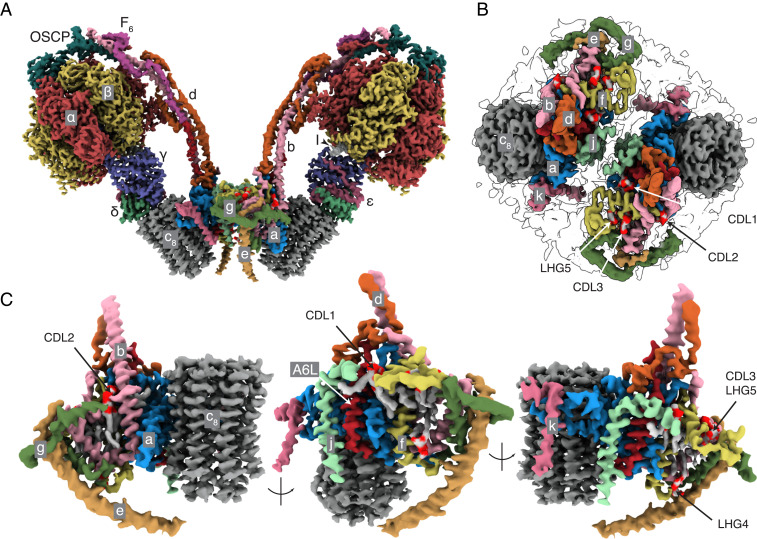
Fig. 1.
Structure of dimeric bovine ATP synthase. The state 1–state 1 dimer is depicted with each monomer inhibited by residues 1 to 60 of the inhibitor protein IF1, states 1, 2, and 3 being the three rotational states of the F1-domain in each monomer relative to the PS. (A and B) The densities derived by cryo-EM represented as volume zones within 2.0 and 1.8 Å, respectively, of the fitted atomic model, viewed in A from the side (orthogonal to the plane of the IMM) and in B from inside the mitochondrial matrix toward the interface between monomers. In A, the detergent micelle, and in B, the F1-domain and the membrane extrinsic region of the PS, have been removed for clarity. The inhibitor protein is labeled I. In B, the outline of the detergent micelle is indicated by gray lines. (C) Arrangement of subunits in the membrane domain of the monomer. The α-, β-, γ-, δ-, and ε-subunits of the F1-catalytic domain are red, yellow, blue, indigo, and green, respectively, with the central stalk (subunits γ, δ, and ε) attached to the c8-ring (dark gray) in the membrane domain in contact with subunit a or ATP6 (cornflower blue). The PS subunits OSCP, b, d, and F6 are teal, light pink, orange, and magenta, respectively, and the A6L subunit is brick red. In the region of the monomer–monomer interface, subunits e, f, g, j, and k are khaki, straw yellow, forest green, sea-foam green and dark pink, respectively. Cardiolipin (CDL) and phosphatidyl-glycerol (LHG) phosphate headgroups are scarlet, and the acyl chains are gray. See also Movie S1.

