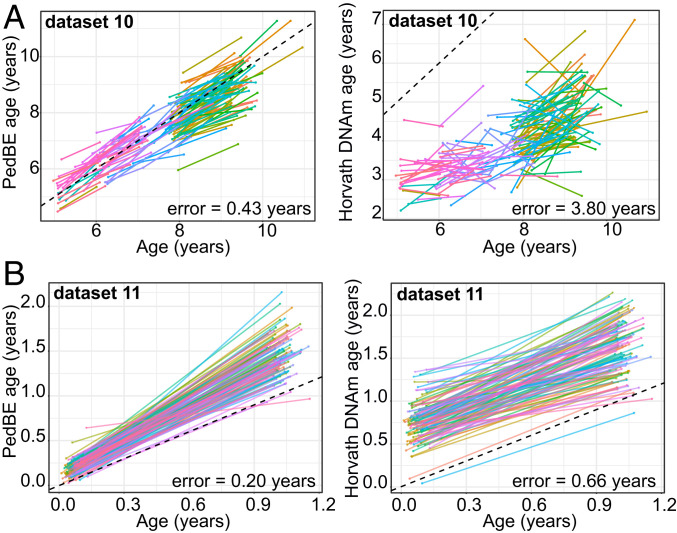
Fig. 2.
Longitudinal data demonstrated higher accuracy of the PedBE clock as compared to the pan-tissue Horvath DNAm clock. (A, Left) Dataset 10 PedBE clock versus chronological age across 2 time points (follow-up ranged from 6 mo to 2 y, depending on the individual). Each point color represents an individual separated by a line indicating the time between sampling. (Right) Dataset 10 pan-tissue Horvath DNAm clock versus chronological age. (B, Left) Dataset 11 PedBE clock versus age across 2 times points separated by 1 y between sampling. (Right) Dataset 11 pan-tissue Horvath DNAm clock versus chronological age. Each colored line represents an individual and the time between sampling is denoted by the beginning and end of each line. Time gaps between sample collection varied across individuals ranging from 6 mo to 2 y. Additionally, for dataset 10, individuals at time point one varied in age between 4 and 12 y. PedBE age was calculated for each individual at both time points.

