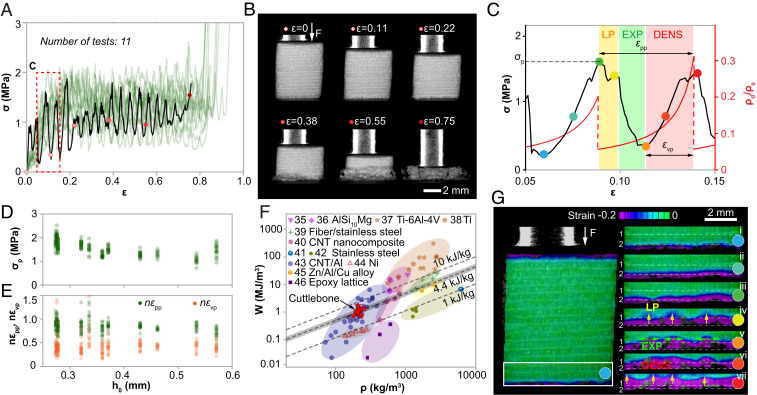
Fig. 2.
Mechanical performance of the chambered cuttlebone structure under compression. (A) Stress–strain curves of 11 compression tests. (B) Snapshots of deformation stages corresponding to the black curve in A. (C) A typical period of the stress–strain curve exhibits three stages, namely, local penetration (LP), expansion (EXP), and densification (DENS). The red curve plots the relative density of the damaged chamber during deformation. , : peak-to-peak strain and valley-to-peak strain in a stress–strain period. is the density of the constituent material. (D) Distributions of peak stress, , versus chamber height, . (E) Distributions of normalized peak-to-peak strain, , and normalized valley-to-peak strain, , versus chamber height, . (F) Energy absorption capacity (W) versus density for cuttlebone in comparison to representative synthetic foams reported in literature, including AlSi10Mg open-cell foams (35, 36), titanium foams (37, 38), sintered fiber stainless-steel foams (39), carbon nanotube reinforced nanocomposites (40), stainless-steel foams (41, 42), carbon nanotube reinforced aluminum foams (43), nickel foams (44), Zn/Al/Cu alloy foams (45), and epoxy foams (46). The dashed lines represent different W/ρ values, and the shaded area highlights the standard deviation of W/ρ for cuttlebone. (G) Digital image correlation (DIC) results corresponding to the points marked in C. The deformation is mapped with Hencky strain.

