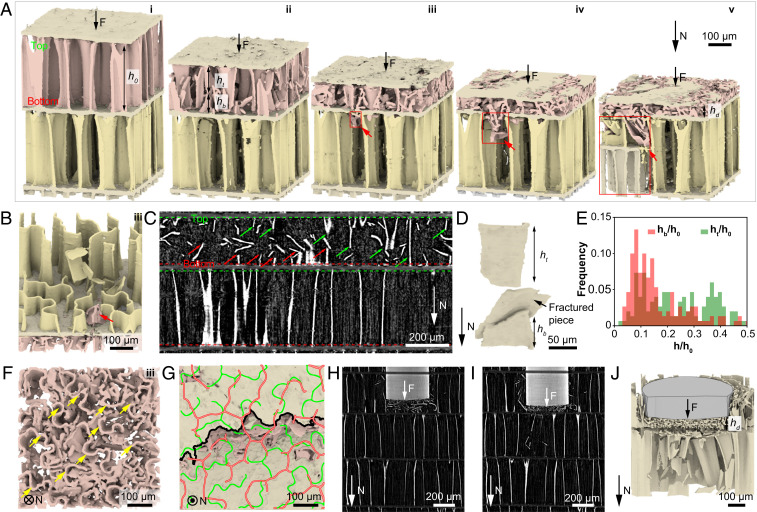
Fig. 3.
Synchrotron µ-CT based in situ mechanical analysis. (A) 3D reconstruction of the progressive failure process of two adjacent chambers under compression. The red arrows and red boxes indicate the local penetration of a septum and expansion of wall fracture, respectively. and denote the heights of fractured wall attached to septum’s top and bottom sides, respectively. (B) A 3D rendering image highlighting a septum penetrated by fractured walls at stage iii in A. (C) A vertical reconstruction slice showing the fracture of vertical walls, where the green and red arrows indicate the top and bottom parts of the fractured walls, respectively. (D) A 3D rendering image of a representative fractured wall. (E) The distribution of normalized height and (N = 190). (F) Top view of the damaged chamber corresponding to stage iii in A. The yellow arrows indicate the intact top wall–septum connections. (G) A representative fracture path of a septum (black profile). The green and red profiles represent the adjacent wall patterns connected to the septum. (H and I) Two consecutive vertical reconstruction slices showing the deformation of the cuttlebone structure during a flat punch indentation test. (J) A 3D rendering image of the fractured chambers corresponding to I.

