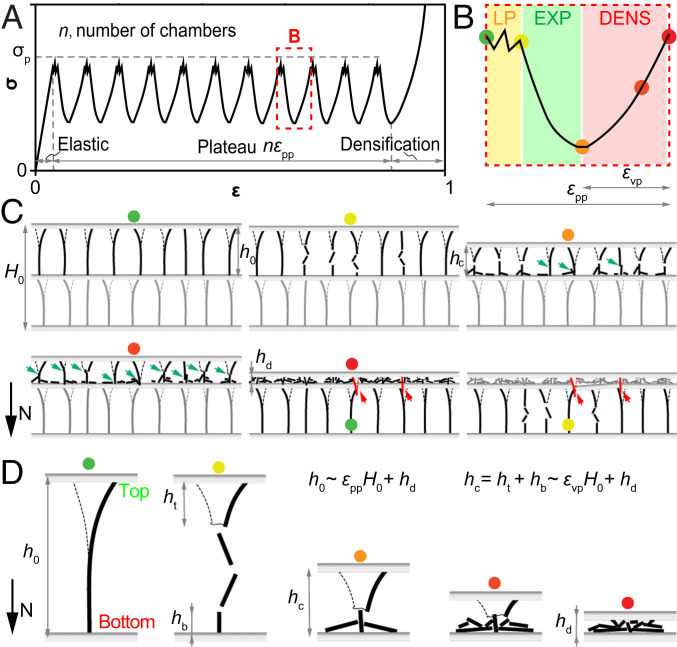
Fig. 6.
Correlation between the macroscopic response and the microstructure of cuttlebone. (A) Cuttlebone exhibits the typical stress–strain response of cellular materials macroscopically. (B) Each period in the plateau regime is characterized by local penetration (LP), expansion (EXP), and densification (DENS). (C) The chamber level deformation exhibits local wall fracture, extensive wall contact (green arrows), and septum fracture induced by fractured wall segments (red arrows). (D) Asymmetric fracture at the wall level. , , , and are wall heights illustrated in the plot, is the sample height, and is the contact height. The geometric parameters are related to the peak-to-peak, and peak-to-valley strains by and .

