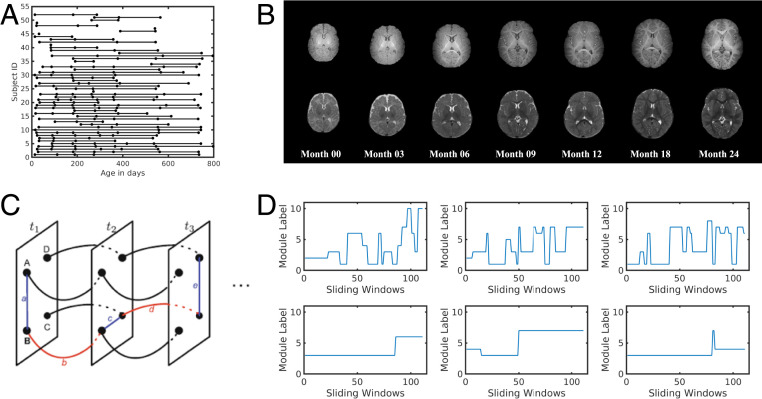
Fig. 1.
Illustration of data distribution and multilayer community detection. (A) The distribution of the age information for all subjects. (B) Examples of T1-weighted and T2-weighted images obtained from a child who underwent longitudinal MRI at birth and 3, 6, 9, 12, 18, and 24 mo of age. (C) Illustration of the multiplayer networks. Each node was linked to itself one time window before and after. (D) Examples of dynamic module transition for nodes with frequent module transitions (Top) and few transitions (Bottom).

