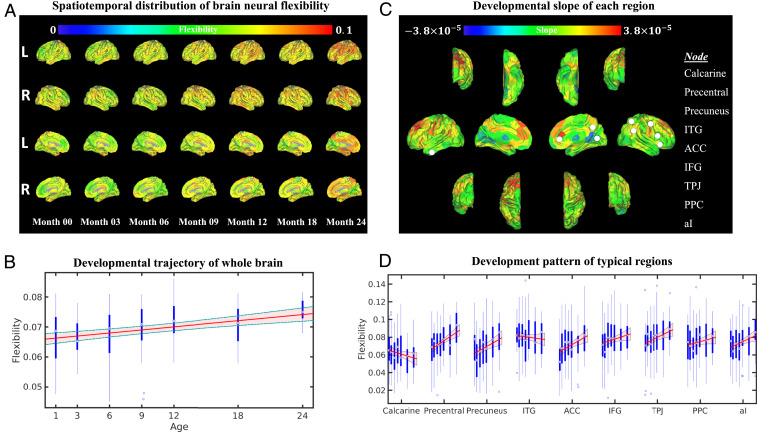
Fig. 2.
Spatiotemporal development of brain neural flexibility. (A) Spatiotemporal distribution of regional neural flexibility at 0, 3, 6, 9, 12, 18, and 24 mo of age. (B) The developmental pattern of whole-brain neural flexibility. The red line and shaded area represent the fitted trajectory of whole-brain neural flexibility and 95% confidence interval (LME model, F test, ). The blue boxplots represent the distribution of whole-brain neural flexibility at each age group. (C) The developmental slope of the neural flexibility at each brain region from birth to 2 y of age is shown on brain surfaces (colored bar represents the slope values). (D). Regional-specific developmental patterns of brain regions, including calcarine fissure, precentral gyrus, precuneus, ITG, ACC, IFG, TPJ, PPC, and aI. These chosen brain regions are marked with white filled circles in C. Blue boxplots represent the distribution of neural flexibility of each region at 0, 3, 6, 9, 12, 18, and 24 mo of age. The P values of the LME fitted trajectories after FDR correction were as follows: , , , , , , , , and .

