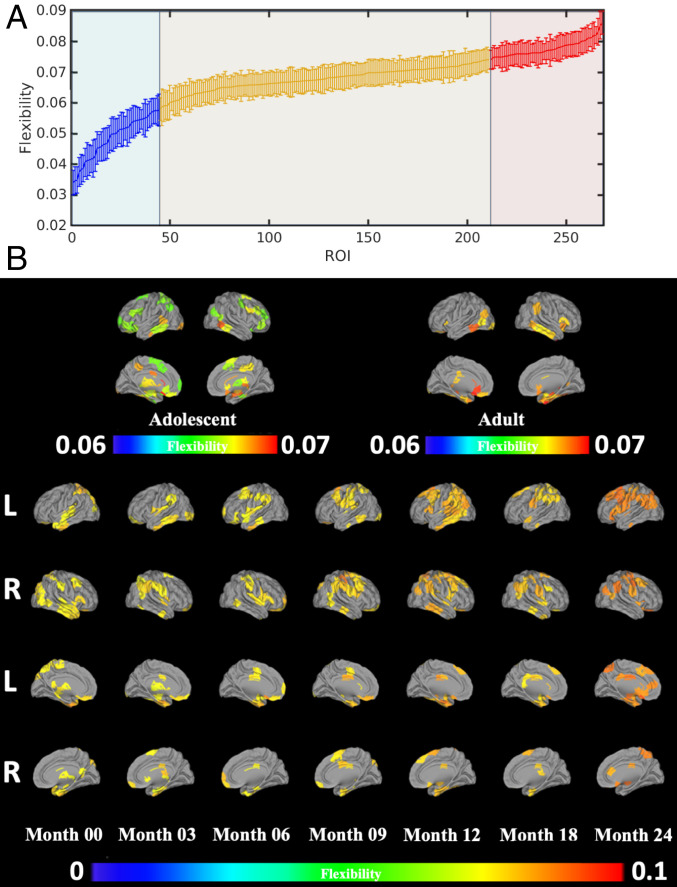
Fig. 4.
Brain flexible club. (A) An example of ranked regional flexibility from month 0 (red/blue indicate regional neural flexibility significantly higher/lower that that of whole-brain neural flexibility; orange indicates regions with no significant difference, paired t test, ). Error bars indicate the SEs. (B) Spatial distribution of the brain flexible clubs. The flexible clubs of adolescents (ABCD) and adults (HCP) were included for comparison. Color bars represent neural flexibility.

