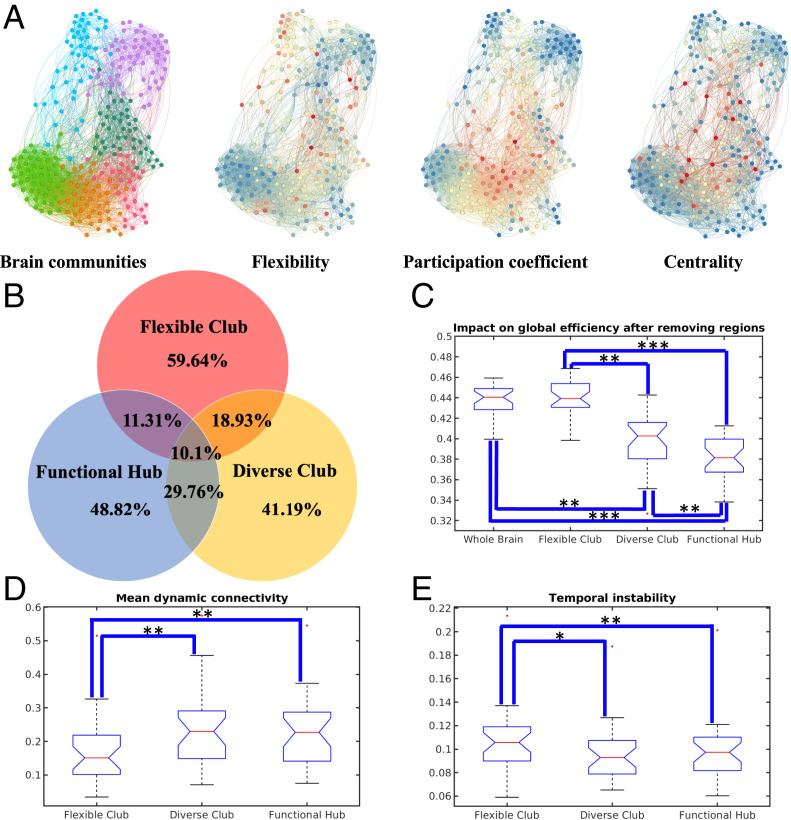
Fig. 5.
Comparisons among brain flexible club, diverse club, and functional hub. (A) Visualization of brain communities, with the corresponding neural flexibility, participation coefficient, and BC (red/blue color corresponding to high/low parametric values). (B) The spatial overlapping ratios among brain flexible club, functional hub, and diverse club at birth. The functional hub and diverse club were generated from 10% connectivity matrices. These findings were consistent across different age groups, as well as different choices of sparsity (i.e., 5%, 10%, 15%, and 20%) of static connectivity matrices (SI Appendix, Fig. S12). Statistical comparisons of brain resilience to targeted attacks (C), mean dynamic connectivity strength (D), and mean temporal instability (E) among brain flexible club, diverse club, and functional hub. The results at birth are shown and additional results across different age groups, as well as different choices of sparsity (i.e., 5%, 10%, 15%, and 20%) of static connectivity matrices are shown in SI Appendix, Fig. S12. Group comparisons were performed for flexible club, diverse club and functional hub. Statistical significance levels: , , .

