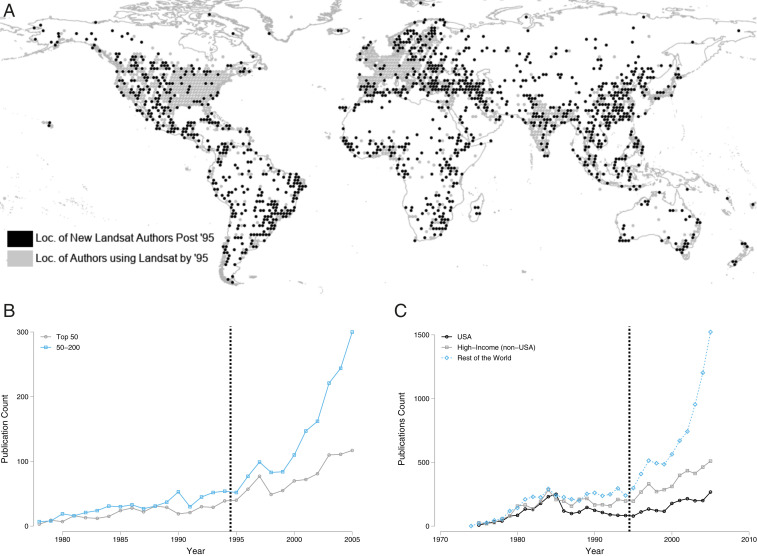
Fig. 2.
How data access affects who participates in Landsat research. This figure explores the effects of lowering costs of data access on authors’ locations. (A) A map where each light gray dot represents the presence of at least one author institution that has published a paper using Landsat data before data access costs were reduced. The dots in black represent locations where an author institution published a paper using Landsat data only after data access costs were reduced. A graph depicting this change is found in SI Appendix, Fig. S6. (B) Total number of Landsat publications separated by institutional rank (top 50 vs. 50 to 200) as per the Quacquarelli Symonds (QS) World top university rankings. (C) Total number of publications separated by the authors’ country income categories. For publications with authors from different country income groups, we sort the publication based on the minimum country income group. Overall, the data suggest that lowering costs of data access was particularly helpful for authors in lower-ranked institutions and in non–high-income countries.

