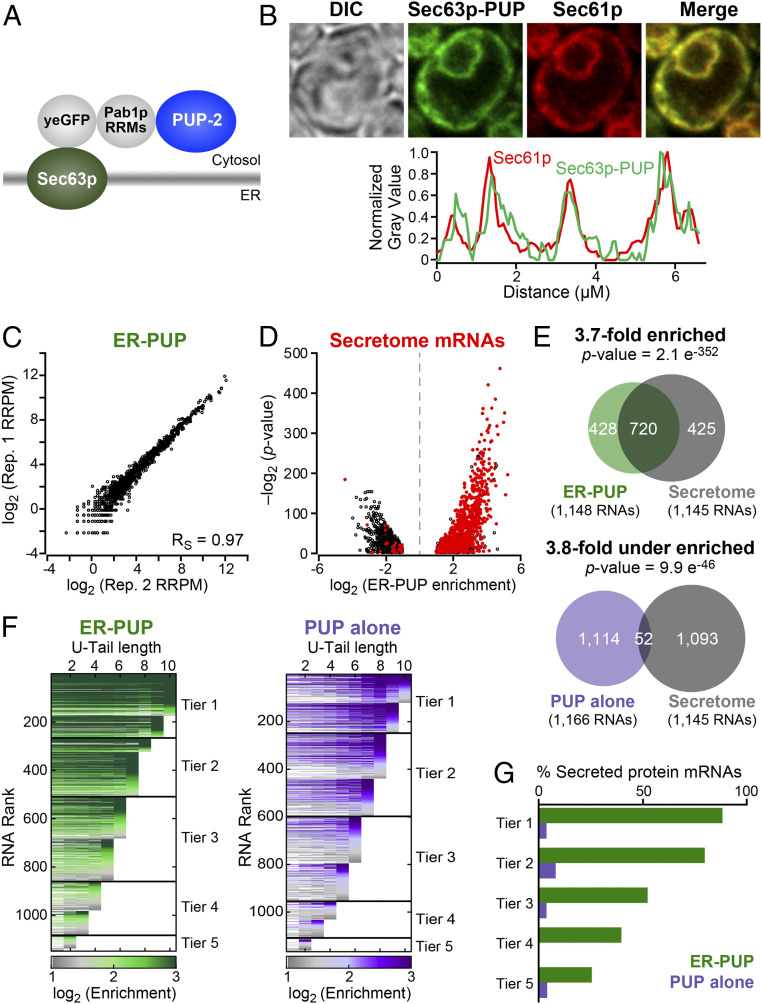
Fig. 1.
ER-localized recording provides an in vivo record. (A) ER-PUP chimera designed to tag ER-proximal RNAs. PUP(+PAB) was fused to the C terminus of Sec63p, which tethers the chimera to the cytosolic surface of the ER (29). (B) Subcellular distribution: ER-PUP GFP fluorescence (green) vs. an ER marker (30, 31), Sec61p-mCherry (red); merged (yellow). Fluorescence intensities for ER-PUP (green) and the ER marker (red) across a representative cell. The cells were imaged using a 63× numerical aperture 1.4 objective lens with oil immersion. (C) Reproducibility of ER-PUP recording across biological replicates. (D) Distribution of mRNAs that encode secreted proteins (“secretome”) among the ER-PUP–recorded mRNAs. (E) Secretome mRNAs in recording by ER-PUP and PUP alone. (F) Distribution of relative enrichment (ER-PUP vs. PUP alone) across each U-tail length. RNA species that had significant (adjusted P < 0.05) difference [log2(∆ recorded reads) ≥ 1] in recording efficiency (enrichment) in any of 10 U-tail lengths (1U-10Us) were isolated and plotted as horizontal lines. Each row is one mRNA. Lines are segmented, and segments colored in accord with enrichment values: most enriched denoted in green (ER-PUP) or purple (PUP) and the lowest gray (both). RNAs were binned into five groups (“tiers”), and tiers ranked by the highest tag length (e.g., tier 1 RNAs had a minimum of 9 to 10 U’s; tier 5 had a minimum of 1 to 2 Us). (G) Proportion (%) secretome mRNAs in each tier of ER-PUP-recorded (green) or PUP alone-recorded (purple) tier.

