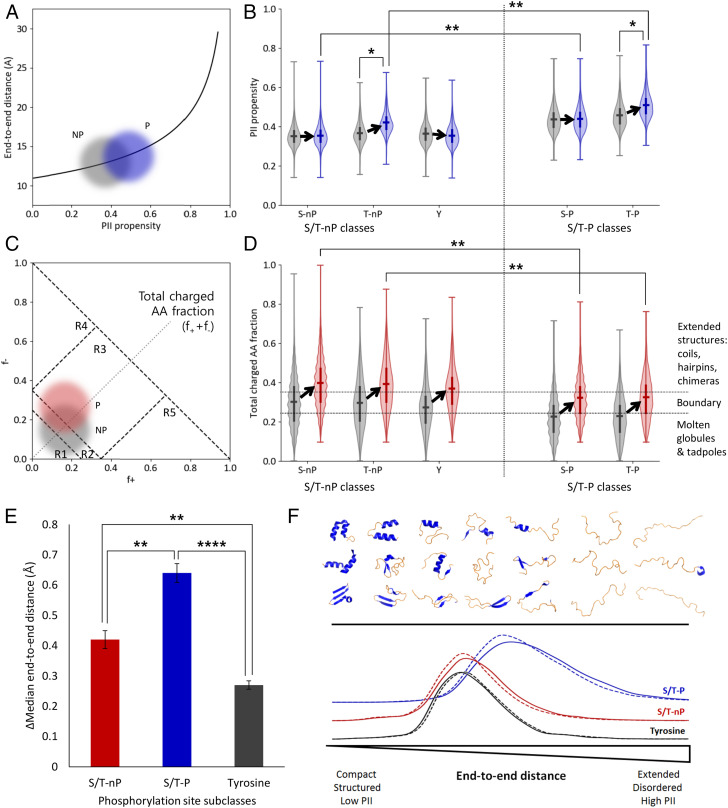
Fig. 4.
Phosphorylation sites containing +1 Pro (S/T-P) are energetically poised to respond to phosphorylation by local extension, mediated by charge and PII propensity. (A) Conceptual plot illustrating expected local end-to-end distance increase (32) due to phosphorylation of an ensemble distribution of 29-mer sequence fragments. Gray cloud represents nonphosphorylated sequences (NP) and blue cloud represents singly phosphorylated sequences (P). (B) Violin plots of ensemble distributions of sequence PII propensities (20) before (gray) and after (blue) phosphorylation. S/T-P classes in particular (the two rightmost pairs of distributions) exist in an extension range nearest the exponential increase in A. Significance bars demonstrate that the postphosphorylation ensembles of S/T-P occupy a very different conformational manifold than do the postphosphorylation ensembles of S/T-nP. (C) Conceptual plot illustrating expected charge change due to single phosphorylation (P) of a distribution of 29-mers. The numbered regions R1 through R5 represent conformational regimes as described in Das and Pappu (37). Note that the dashed diagonal line corresponds to the y axis in D. (D) Violin plots of ensemble distributions of sequence charge properties before (gray) and after (red) phosphorylation. Dotted horizontal lines represent conformational regimes as described in Das and Pappu (37). S/T-P sites (the two rightmost pairs of distributions) specifically exhibit a less unstructured conformational manifold prior to a phosphorylation event, and thus the Pro effectively buffers a conformational transition with an increased PII propensity. Significance bars demonstrate that the postphosphorylation ensembles of S/T-P occupy a very different conformational manifold than do the postphosphorylation ensembles of S/T-nP. Notably, the S/T-nP ensembles cross the boundary region, while the S/T-P ensembles do not. (E) S/T-P sites undergo the largest expected extension upon phosphorylation due to contributions from both extension (PII structure) and charge repulsion (see SI Appendix, Figs. S3–S6, in particular SI Appendix, Fig. S4). (F) Schematic summarizing local changes in the conformational ensemble upon phosphorylation. The top half represents an idealized conformational spectrum ranging from mostly folded (left side) with lower end-to-end distance to mostly disordered (right side) with higher end-to-end distance. Conformational change after the phosphorylation event is measured by end-to-end distance (bottom), mediated by PII propensity and charge interactions. Along this spectrum, tyrosine phosphorylation (black curve) exhibits the smallest population end-to-end distances, S/T-nP phosphorylation (red curve) exhibits intermediate distances, and S/T-P site phosphorylation exhibits the largest distances (blue curve). Dashed line: distribution before phosphorylation. Solid line: distribution after phosphorylation.*P < 0.05, **P < 0.01, ****P < 0.0001.

