Fig. 1.
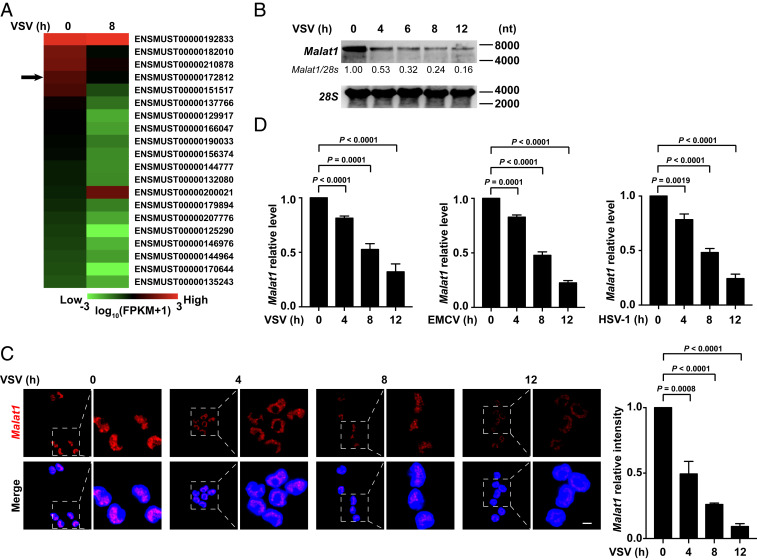
The expression of nuclear lncRNA Malat1 decreases upon viral infection. (A) Heat map of top 20 abundant nuclear lncRNAs in RAW264.7 cells at resting state which are changed more than twofold after VSV infection for 8 h. ENSMUST00000172812 (Malat1) is pointed out by black arrow. (B) Northern blot assay of Malat1 level in RAW264.7 cells along with VSV infection for indicated hours. Relative intensity of Malat1 is calculated by the ImageJ program. (C) Confocal microscope images from FISH assay of Malat1 level in RAW264.7 cells along with VSV infection for indicated hours. Relative fluorescence intensity of Malat1 is calculated by the ImageJ program (Right). Red, Malat1; blue, DAPI. (Scale bar, 5 μm.) (D) qRT-PCR analysis of relative Malat1 level in RAW264.7 cells along with VSV, EMCV, and HSV-1 infection for indicated hours, respectively. Data are representative of three independent experiments (B and C) or shown as mean ± SD of n = 3 biological replicates (C and D), two-tailed unpaired Student’s t test (C and D).

