Figure 1.

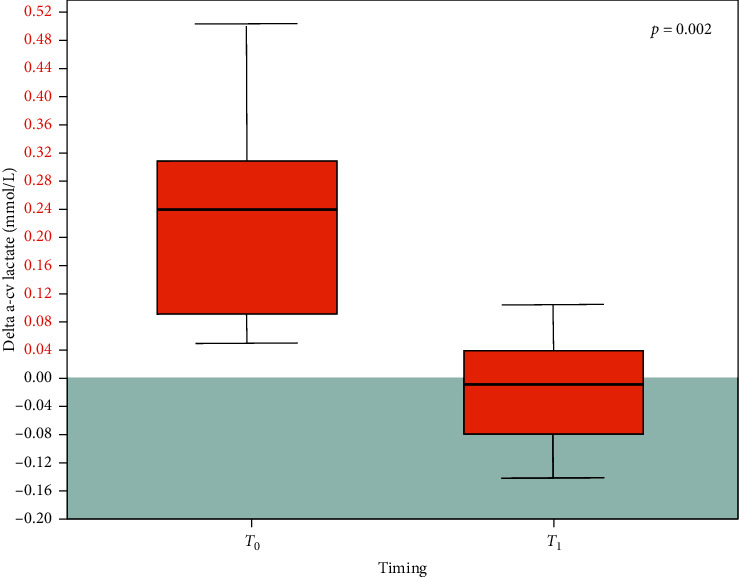
Delta a-cv lactate before (T0) and after (T1) canakinumab administration in 13 patients. Black horizontal line inside the boxes: median. Box height: interquartile range. Grey area: normal Delta a-cv lactate values (≤0).

Delta a-cv lactate before (T0) and after (T1) canakinumab administration in 13 patients. Black horizontal line inside the boxes: median. Box height: interquartile range. Grey area: normal Delta a-cv lactate values (≤0).