
FIG. 7.
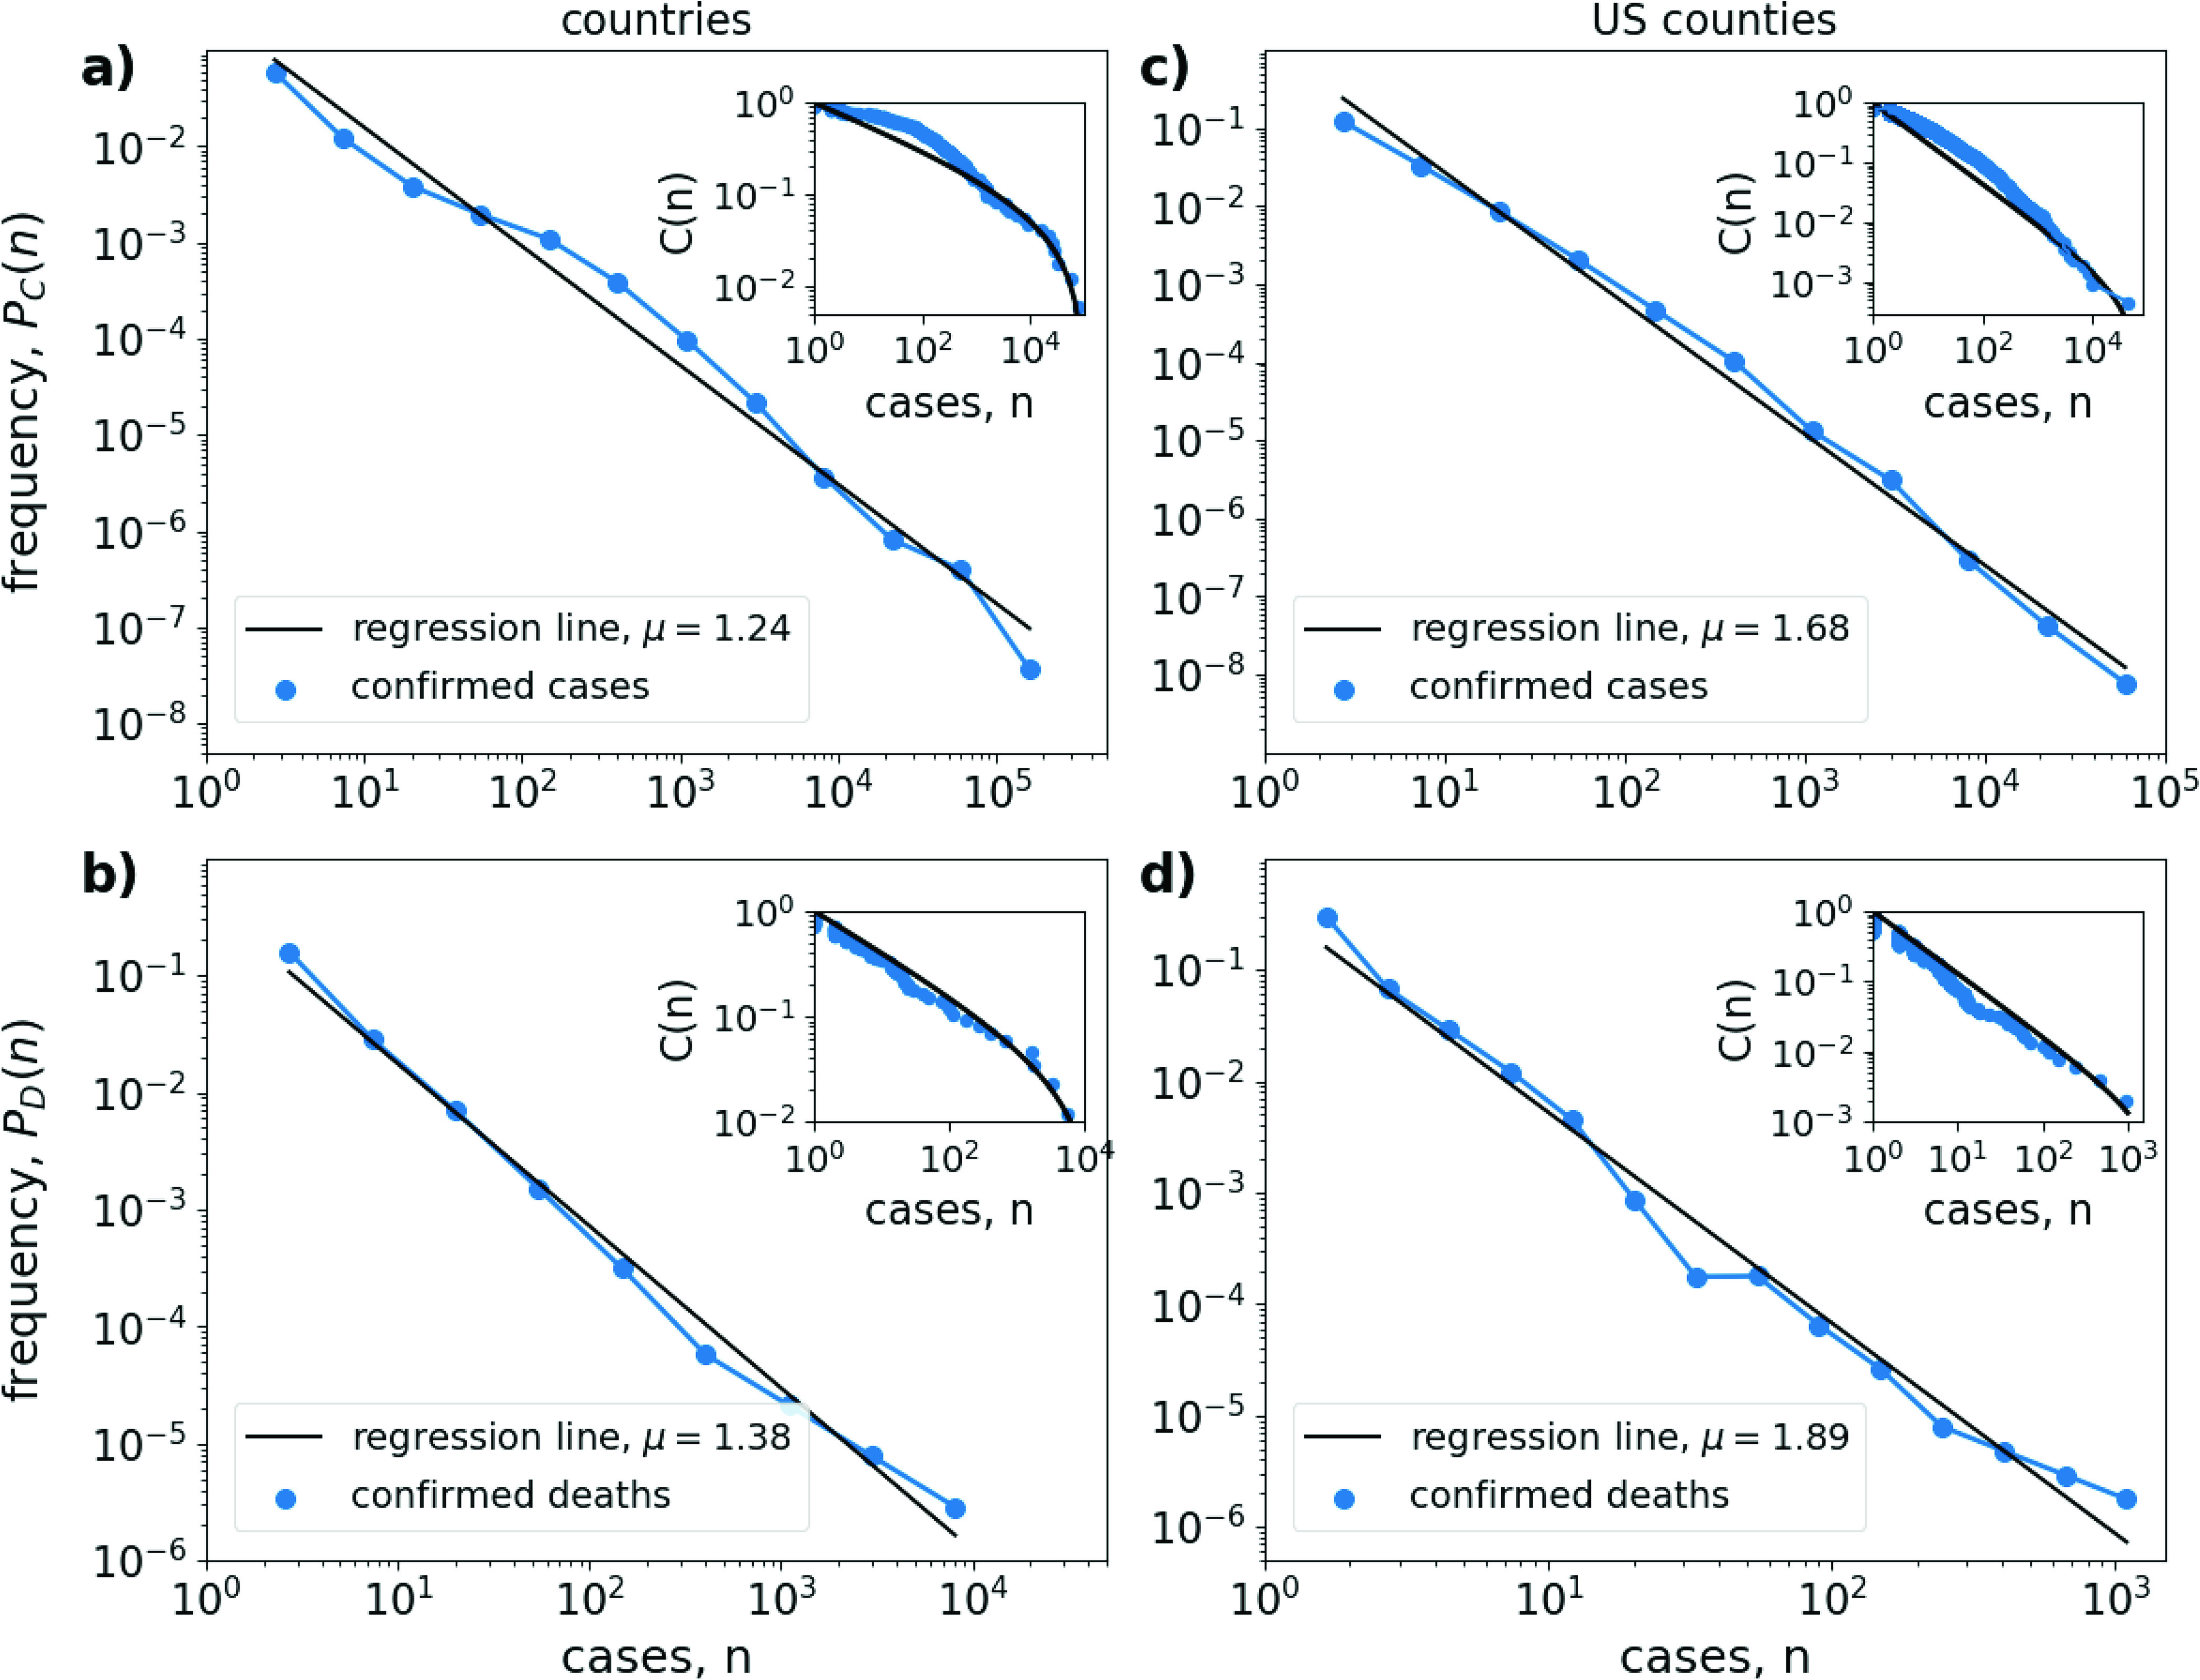
Alternative calculation of the distribution of COVID-19 case numbers in countries worldwide and counties in the US. Same as Fig. 1, but for the alternative histogram algorithm, using a histogram of log-transformed case numbers (see Appendix A). Left column: Estimated probability (blue lines and circles) for a country to have a certain number of (a) confirmed cases () and (b) confirmed deaths () on March 22, 2020. Right column: The same for the 2160 US counties that have been invaded by the coronavirus on March 31, 2020, for (c) confirmed cases and (d) confirmed deaths. Insets: Cumulative fraction of countries, or counties, with case number .