Figure 4.

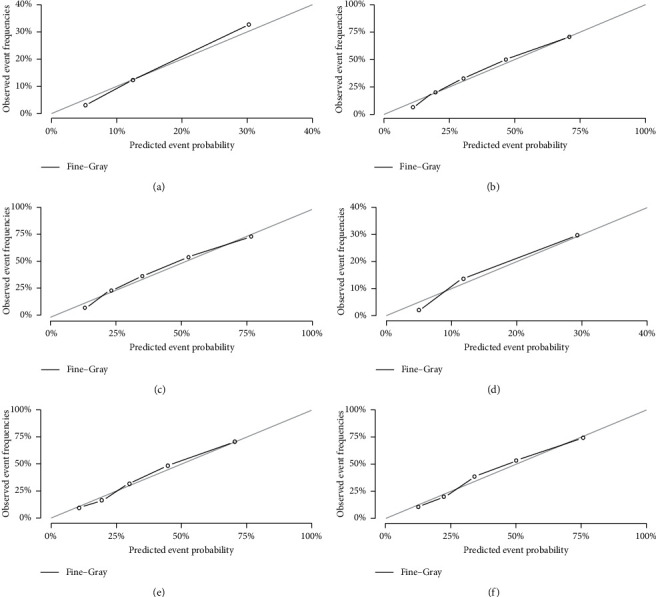
Calibration plots of the nomogram for 1-, 3-, and 5-year predicting RMS cause-specific mortality of the training set (a, b, c) and validation set (d, e, f).

Calibration plots of the nomogram for 1-, 3-, and 5-year predicting RMS cause-specific mortality of the training set (a, b, c) and validation set (d, e, f).