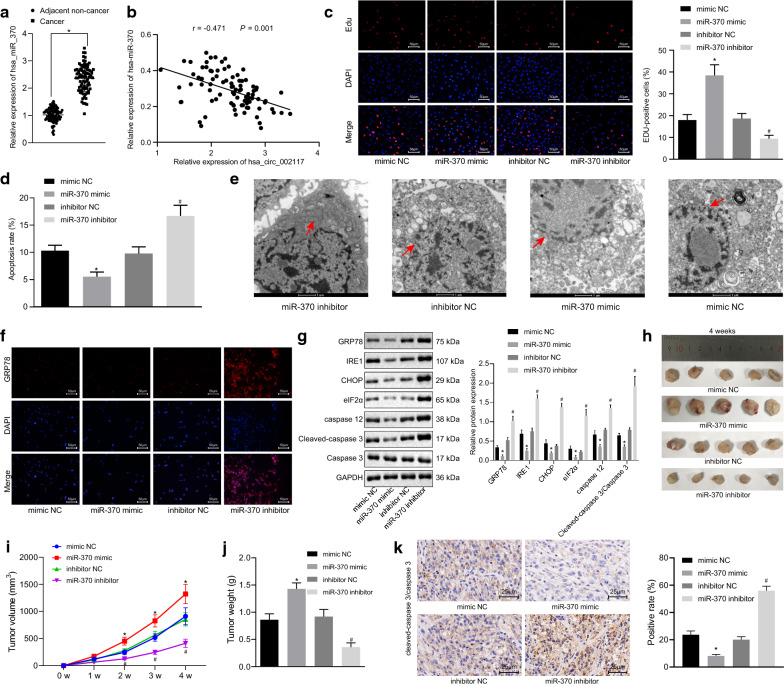
Fig. 5.
miR-370 silencing leads to ER stress induced-apoptosis in gastric cancer. a RT-qPCR determining miR-370 expression in gastric cancer and adjacent normal tissues (N = 87). b Correlation between miR-370 and overall survival rate of gastric cancer patients. c Proliferation in AGS cells after alteration of miR-370 determined by EdU (×200) and quantitation of the proliferation rate. d Apoptosis in AGS cells after alteration of miR-370 determined by flow cytometry and quantitation of apoptotic rate. e Ultrastructure of AGS cells after alteration of miR-370 observed by transmission electron microscopy (×10,000). Arrow refers to ER. f GPR78 expression in AGS cells after alteration of miR-370 determined by immunofluorescence staining (×200). g Protein expression of GRP78, IRE1, CHOP, eIF2α, caspase 12, caspase 3 and cleaved-caspase 3 in AGS cells after alteration of miR-370 determined by Western blot and the corresponding quantitation. h Representative xenograft tumor pictures upon treatment with miR-370 mimic, miR-370 inhibitor or controls (N = 05). i Tumor volume of mice treated with miR-370 mimic, miR-370 inhibitor or controls (N = 05). j Tumor weight of treated with miR-370 mimic, miR-370 inhibitor or controls (N = 05). k Immunohistochemistry of cleaved-caspase 3 expression in xenograft tumor mice upon treatment with miR-370 mimic, miR-370 inhibitor or controls (×400). *p < 0.05 vs. adjacent normal tissues or mimic NC. #p < 0.05 vs. inhibitor NC. Data were shown as the mean ± standard deviation. When two paired group data followed normal distribution and homogeneity of variance, statistical comparison was performed with paired t-test. Two unpaired group which followed normal distribution and homogeneity of variance was analyzed by unpaired t-test. Variables were analyzed at different time points using Bonferroni-corrected repeated measures ANOVA. The cell experiment was in triplicate

